博客

家

博客

  • How to Select the Right Energy Storage System for Commercial Solar Projects

    How to Select the Right Energy Storage System for Commercial Solar Projects

    Oct 22, 2026
    The storage system, not the PV array, usually decides whether your commercial solar project pencils out. Most selection mistakes happen before you request any quote. Vendors then send different chemistries, architectures, and capacity figures, and you cannot tell which numbers to trust. To select the right energy storage system, size it first, compare options, stress-test the ROI, then vet suppliers.   Key Takeaways Size your battery system correctly by matching power and capacity to your load profile. Compare AC-coupled and DC-coupled systems and battery chemistries to fit your project needs. Vet suppliers using a scorecard and demand safety certifications and clear warranty terms.   How to Select the Right Energy Storage System: Sizing Basics Battery systems dominate commercial storage because they store electricity directly and discharge it when your business needs power. Sizing is the first step, and it decides everything that follows. Get the numbers wrong here, and no chemistry or warranty can rescue the project.   kW vs. kWh: Power Rating and Usable Capacity Two specifications carry most of the weight. The power rating, measured in kW, tells you how much power the system can deliver or absorb at one moment. Usable capacity, measured in kWh, tells you how much energy it can store and release over time. A system can have a large tank and a small pipe, or the reverse. Your load profile decides which limit binds first. Round-trip efficiency is the third specification, and buyers often overlook it. Electricity is converted, stored, managed, and converted again, with losses at every step. Cell resistance turns energy into heat, cooling systems consume power, and AC/DC conversions each lose a fraction. Small efficiency gaps compound under daily cycling:   System Capacity Cycles Per Year Round-Trip Efficiency Annual Energy Loss 100 MWh 365 90% 3,650 MWh lost   BESS Sizing With a Worked Example Start with a simple estimate: usable energy equals load power multiplied by discharge duration. A project needing 50 kW for 2 hours requires about 100 kWh of usable energy. Treat these figures as illustrative assumptions, not measured performance. Nameplate capacity will not deliver that 100 kWh. According to Ace Battery's comparison of rated versus usable energy, usable energy typically falls within 80%–95% of rated capacity, a shortfall of roughly 5%–20% driven by depth of discharge and round-trip efficiency. Depth of discharge matters on its own: Most modern lithium-ion batteries have DoDs ranging anywhere from 80% to 95%, with many best-in-class solutions sporting 100% depth of discharge and a much longer lifespan. Divide your energy requirement by the DoD, then divide again by round-trip efficiency, and you approach a realistic nameplate figure. Add margin for operating reserve, temperature, and degradation. Thermal performance drives available capacity and aging, so cooling strategy is a sizing decision, not an accessory. Peak-shaving projects need more analysis still: 12–24 months of interval load data, demand-charge rules, the charging window, and battery power limits. Both oversizing and undersizing hurt ROI.   Comparing Architectures, Chemistries, and ROI AC-Coupled vs. DC-Coupled Systems Your coupling choice depends on whether the solar array already exists. AC-coupled systems keep the existing solar inverter and add a separate battery inverter. That makes AC coupling the more affordable path for a retrofit, because you preserve equipment you already own. DC-coupled systems route electricity from the panels straight to the battery over a DC bus. Fewer conversions mean higher charging efficiency from solar, and a single hybrid inverter can cut equipment duplication in a new build. DC coupling also creates one point of common coupling, which reduces interconnection study costs compared with multiple connection points. Match the architecture to your project stage. New-build solar-plus-storage projects in the hundreds-of-kilowatts range suit DC coupling, especially when you value PV-to-battery round-trip efficiency. Retrofits and projects needing consistent performance across grid charging and solar charging fit AC coupling well. Evaluate cost in two layers: upfront installation and long-term operating value. This step matters when you select the right energy storage system for an existing array.   Battery Chemistry and Payback Drivers Chemistry sets your cycling profile and your space budget. LFP cells typically deliver roughly 3,000–8,000+ cycles, while NMC cells deliver roughly 1,000–3,000 cycles. LFP also offers a larger thermal safety margin and needs no nickel or cobalt. NMC wins on energy density, at roughly 200–300 Wh/kg against 90–205 Wh/kg for LFP, so it fits space-constrained sites. For daily-cycled stationary storage, LFP usually improves lifecycle value; NMC remains appropriate where compact size outweighs cycle life. Now stress-test the ROI. Build savings from electricity bill reductions and demand-charge reduction, then subtract operating costs and lifecycle cost. Label every assumption clearly and avoid promising savings you cannot document. Chemistry, architecture, and cycling profile all feed the same payback model.   Vetting ESS Suppliers With Data and Standards Building a Supplier Scorecard A scorecard turns a stack of brochures into a comparable set of facts. Score every vendor on the same criteria: usable capacity at your site conditions and at year ten, power rating, round-trip efficiency stated AC-to-AC with auxiliary loads included, system architecture, and energy management capabilities. Add safety documentation and certifications, warranty terms, manufacturing capability, and after-sales service. Use a shared 1–5 scale across technical fit, evidence quality, delivery capability, integration scope, and after-sales support. Record the supporting evidence beside every rating, and assign an owner and date to each open gap. Safety documentation deserves its own line. Ask for UL 9540 system-level certification, UL 9540A test reports at cell, module, and unit levels, UL 1973 for modules and packs, UL 1741 for inverters, and IEC 62619 for industrial lithium cells. Many jurisdictions require both UL 9540 certification and UL 9540A test reports before granting project approval. A certified cell does not mean the full system is certified, so demand all three UL 9540A test levels. Warranty terms vary widely, and the headline number rarely tells the whole story: A representative performance guarantee reads: "We guarantee 80% capacity after 10 years" — but only if the system is cycled once daily, kept at 15–25°C, never discharged below 20%, avoids grid charging (for ITC compliance), limits depth of discharge to 90%, and operates exactly per a lengthy operational manual. Commercial systems in the 20 kWh to 2 MW range typically carry around 10 years of coverage, rated 5,000 cycles at 80% depth of discharge. Performance warranties for larger projects can run 15–20 years and cover power output, energy availability, throughput, and degradation limits. Score the conditions attached to each guarantee, not just its length.   From Specs to a Confident Purchase Standardized performance data supports comparison, risk mitigation, financing, and deal closing. Issue one common load-profile model to every vendor. Require identical outputs: year-one and year-ten usable capacity, bill savings on your actual tariff, auxiliary energy, and full levelized cost of storage. Then evaluate on three axes — technical fit, commercial terms, and service capability. Store 5–15 minute consolidated data in your asset performance management system so you can verify guarantees later. Choosing the right solar storage solution starts with understanding your project's electricity demand, solar generation profile, operating objectives, and local grid requirements. Commercial buyers and EPC contractors should compare battery capacity, power rating, system architecture, energy management capabilities, safety documentation, warranty terms, and lifecycle costs before making a purchasing decision. PNG Solar's relevant energy storage products and technical specifications can then be evaluated against these project requirements to identify a suitable configuration. Verify the actual product range, models, capacity, power, and technical parameters before publication.   Size your system by load profile, adjusting kW and kWh for efficiency and degradation. Compare architectures and chemistry against project needs, stress-test ROI assumptions, then score suppliers on documented performance and warranty terms. Confident decisions rest on project-specific data, not brochure capacity figures. That distinction separates a sound purchase from an expensive guess. Assemble your load data and demand-charge history before requesting quotes. Every supplier then competes on the same basis, and you can select the right energy storage system with evidence behind you.   FAQ How do I know whether my project needs more kW or more kWh? Check your load profile first. A short, intense demand spike calls for higher power rating. A long overnight backup window calls for more usable capacity. Your interval load data and demand-charge history reveal which limit binds first. Can I add storage to my existing solar array? Yes. AC-coupled systems keep your current solar inverter and add a separate battery inverter, which preserves equipment you already own. This path usually costs less than replacing working hardware for a retrofit. Which battery chemistry suits daily commercial cycling? LFP cells typically deliver roughly 3,000–8,000+ cycles, so they usually improve lifecycle value for daily-cycled stationary storage. NMC cells offer higher energy density at roughly 200–300 Wh/kg, which fits space-constrained sites better.
  • Bifacial Solar Modules for Utility Projects: Complete Installation and ROI Guide

    Bifacial Solar Modules for Utility Projects: Complete Installation and ROI Guide

    Oct 22, 2026
    Bifacial Solar Modules now anchor most utility ground-mount projects, yet installation practice and ROI math still decide whether they pay off. You need defensible numbers, not marketing claims. Remember one rule: bifaciality factor is not energy gain. Real gains are site- and design-specific, typically 8%–15% under optimal conditions. Monofacial remains a valid fit for some sites.   Key Takeaways Bifacial gain varies by site. Test your albedo, height, tilt, and spacing to find real energy gain. Design matters. Use trackers and proper spacing to boost rear-side light and lower costs. Model your ROI. Compare incremental cost and energy to see if bifacial pays off for your project.   What Bifacial Solar Modules Are and How They Differ Bifacial solar modules collect irradiance on both faces and convert light hitting the rear side into additional power. A transparent backsheet or dual-glass construction lets reflected light reach the rear cells. You gain energy from the same module area, mounting structure, and land footprint. That dual-face collection is the entire premise of the technology.   Bifaciality Factor vs. Energy Gain The bifaciality factor describes the module alone. It is the ratio of rear-side nominal efficiency to front-side nominal efficiency, measured under standard test conditions: Bifaciality factor (%) = [η_rear / η_front] × 100 A module with 350 W rear test power and 500 W front test power has a bifaciality of 350/500 = 70%. The rear face produces 70% of the front's capability under test light. This is a datasheet characteristic, not a field result. Energy gain is a system-level increment. It depends on how much light actually reaches the rear face at your site. ArcVera Renewables reports an average gain of 3% to 10%, and up to 30% depending on albedo, structure elevation height, and ground cover ratio. An 80% bifaciality rating never means 80% more energy.   Utility-Scale Fit and Tradeoffs Bifacial solar modules are now the de facto choice for utility ground-mount projects. Dual-glass construction and falling price premiums made them the default specification for new builds. Monofacial modules remain a valid fit for low-albedo ground or budget-constrained sites. Match the module to the site, not to a trend.   Site and Design Factors That Drive Performance Rear-side irradiance is not a fixed property of the module. Four site and design variables jointly determine how much reflected light reaches the back face: ground albedo, mounting height, tilt, and row spacing. Change one and the others shift in response.   Albedo, Height, Tilt, and Spacing Ground albedo sets the ceiling on reflected light. Fresh snow approaches an albedo near one in the visible region, while deep clean ocean water sits close to zero. Grass typically falls in the 0.15–0.25 range, light gravel and sand in the 0.30–0.45 range, and white membranes above 0.60. Moisture, aging, soiling, and sun angle all shift these values over the project life. Mounting height controls how much of that reflected light the rear face actually sees. Clearance below 0.5 m yields limited rear irradiance, with gains often under 5%. A minimum of roughly 0.8–1.0 m is recommended, and 1.2–2.0 m is optimal depending on module size and tilt. Taller posts widen the sunlit ground patch but raise wind loads and structural cost, so returns flatten quickly over dark ground. Tilt and row spacing interact with albedo and height. A slightly reduced tilt can raise rear exposure while marginally lowering front capture. Insufficient row spacing causes rear-side shading from adjacent rows, and optimal bifacial spacing typically runs 10%–30% larger than monofacial. Lower ground coverage ratio generally raises rear irradiance, while higher GCR packs more capacity per acre and compresses bifacial gain.   Factor Effect on rear-side irradiance Ground albedo Higher albedo substantially raises rear-side irradiance Mounting height Gains rise with clearance, then flatten; taller posts raise cost Tilt Optimum often differs from monofacial; slightly reduced tilt can help Row spacing Insufficient spacing causes rear-side shading from adjacent rows   Mounting and Electrical Design Tracker configurations elevate modules and reduce rear-side shading, conditions that directly enhance bifacial gain. Horizontal single-axis trackers with bifacial modules have become the industry standard for lowest LCOE. Single-axis trackers deliver 15–25% higher energy yield than fixed-tilt systems, with capacity factors typically 24–32%. Two-modules-in-portrait configurations add reduced rear shading, higher GCR, and fewer foundations per MW. String sizing cannot simply follow traditional calculations. Extra rear-side current shifts voltage and current behavior across the day, so engage designers experienced with bifacial-specific electrical requirements. Account for peak bifacial output when selecting controllers and inverters. Conventional irradiance measurements miss rear-side contributions, so monitor both front and rear irradiance plus module temperatures during the first year to establish a baseline and verify expected gains.   Modeling, Installation, and Fit Assessment Modeling Yield with Defensible Assumptions Build your yield case on three tiers of evidence. First, anchor assumptions in technical references: NREL and IEC standards, PVGIS irradiance data, and SAM simulation runs. Second, pull module parameters from the datasheet, including bifaciality, temperature coefficient, and maximum series fuse rating. Third, label every scenario model clearly as an estimate with stated inputs. Reference points help you sanity-check results. Published gains for bifacial solar modules reach 10–30% under optimal conditions, and a 5–8% upfront cost premium is a common planning figure. Treat both as ranges to test, not guarantees. Your albedo, height, and spacing assumptions drive the outcome.   Installation Sequence and Quality Checks Follow a fixed sequence, with a checkpoint at each stage: Survey the site and document ground albedo, rear-face obstructions, and snow patterns. Confirm design and current calculations against the correct Isc for conductors, fuses, inverters, and MLPE. Install foundations per the stamped structural design, holding post heights to plan. Set racking height, tilt, and row spacing, measuring clearance at the lowest module edge. Mount modules in approved clamp zones, inspecting for chipped edges or cracks at delivery. Route wiring away from the rear face, securing leads along rails or frame edges. Commission with polarity, insulation resistance, and I-V curve tracing, adding rear-side irradiance sensors on larger projects. Clamp discipline protects the glass. Match clamp length and position to the installation manual, confirm the approved mounting orientation, and torque to spec, since overtightening can crack glass and clamping outside approved zones can void the warranty. Ask for mechanical test data on the specific module and racking combination: Kiwa PVEL documented a Brazilian tracker site where over 50% of 2 mm glass-glass modules cracked within nine months.   Sourcing Bifacial Solar Modules for Utility Projects Specifications Buyers Should Compare Compare modules at the exact model level, not the brand level. A technology label is not evidence for the module you will actually receive. Request the current datasheet, the test method, and the supporting report before you place a bifaciality value into an energy model. Specification to compare Relevance to utility bifacial sourcing Rated power Determines module output Efficiency Affects power density and land utilization Bifaciality Relevant to rear-side generation Temperature coefficient Important in hot climates Degradation Influences long-term output Dimensions and weight Affect mounting, handling, and transport Voc / Isc Required for electrical system design Mechanical load Important for structural design Warranty Long-term risk consideration Certifications Market and project compliance Availability and price Affect schedule and economics Review first-year degradation, annual degradation, and end-of-warranty guaranteed output for the exact model. Compare temperature coefficients of power across your shortlist, especially for hot climates, rather than relying only on STC efficiency. Confirm tracker compatibility and approved mechanical loads before you commit.   Evaluating Manufacturers and Suppliers Verify the supplier before you negotiate price. Follow a fixed sequence: Check the business license in China's official registry to confirm legal identity and rule out trading companies posing as factories. Validate TÜV, CE, IEC 61215, and IEC 61730 certificates directly with the issuing laboratories. Request a video tour or an in-person visit to confirm real production lines. Send samples to an independent laboratory to verify bifacial performance claims. Contact 3–5 recent buyers about quality consistency and warranty handling. Run a pre-shipment inspection through SGS, Bureau Veritas, or TÜV. Certification alone no longer satisfies utility procurement. Pair it with bill-of-materials-specific bankability testing and ongoing production oversight. Confirm who handles warranty communication, which documents you must submit, and how technical escalations move. For a single accountable partner, PNG Solar supplies bifacial solar modules and utility-scale PV modules alongside full solar project solutions, from specification through delivery.   Calculating ROI for Bifacial Utility Projects Cost, Gain, and LCOE Formulas Start with four plain relations. Incremental cost = bifacial total upfront investment minus monofacial total upfront investment. Incremental energy = annual bifacial production minus annual monofacial production, summed across the project life after applying the degradation rate. LCOE delta = bifacial LCOE minus monofacial LCOE, where LCOE = total lifetime cost / total lifetime energy in MWh. Simple payback in years = incremental cost / annual revenue from incremental energy, with revenue = incremental MWh × PPA price. Run each relation on your own inputs. Do not borrow a published uplift percentage.   Scenario Analysis and Payback The table below states the assumptions for a 5 MW DC comparison against a mono PERC baseline. Assumption Value used in model Location and irradiance High-solar-irradiance area Ground surface Light-colored gravel, ~30% albedo System capacity 5,000 kW for both systems Baseline Year 1 production (mono PERC) ~7,500 MWh Bifacial gain Conservative 9% (675 MWh) PPA price ~$57/MWh Degradation rate ~0.5% per year Module cost ~$0.75/W mono, ~$0.90/W bifacial Inverter cost $300,000 for both Mounting and racking $750,000 vs. $825,000 Labor and installation $600,000 vs. $650,000 Other BOS and soft costs $1,100,000 for both Total upfront investment $6,500,000 vs. $7,375,000 System lifetime 25 years Incremental cost here is 875,000, roughly 13.5% higher. Year 1 incremental revenue is 675 MWh ×57/MWh, about $38,475. Divide $875,000 by that figure and simple payback lands near 23 years before degradation — a marginal case at this gain level. Studies cite 15–17% gains as possible on gravel, which would shorten payback substantially. Now vary albedo. Low-albedo ground such as dark soil or water-adjacent sites suppresses rear irradiance, and payback may exceed the asset life. Medium albedo, the gravel case above, sits near break-even. High albedo, such as snow or white membrane, pushes gain toward the upper published range and delivers the strongest payback. Interpret results as a range, not a single number, and stress-test the albedo assumption first. The FAQ section should answer discrete buyer questions rather than restate these calculations.   Prove bifacial value at your site. Model albedo, mounting design, and electrical configuration together, then link them to energy yield. Compare incremental cost against modeled incremental energy, and translate the result into LCOE and payback under stated assumptions. Verify datasheets, bifaciality ratings, temperature coefficients, certifications, and supplier delivery capability before you commit. Bifacial Solar Modules now lead utility-scale PV, and PNG Solar supports your project with utility-scale modules and complete solar project solutions.   FAQ Do bifacial modules always outperform monofacial modules? No. Rear-side gain depends on albedo, mounting height, tilt, and spacing. Low-albedo ground can suppress the gain below the upfront cost premium. Match the module to your site conditions. How do you verify a manufacturer's bifaciality claim? Request the current datasheet, the test method, and the supporting report. Send samples to an independent laboratory. Confirm certificates directly with the issuing body before you trust the rating. What ground albedo justifies bifacial modules? Light gravel, sand, snow, and white membrane surfaces reflect enough light to support bifacial gains. Dark soil and water-adjacent ground reflect little. Model your actual surface before you commit.
  • N-Type TOPCon vs HJT Solar Panels: Which Technology Is Better for Future Solar Projects?

    N-Type TOPCon vs HJT Solar Panels: Which Technology Is Better for Future Solar Projects?

    Oct 22, 2026
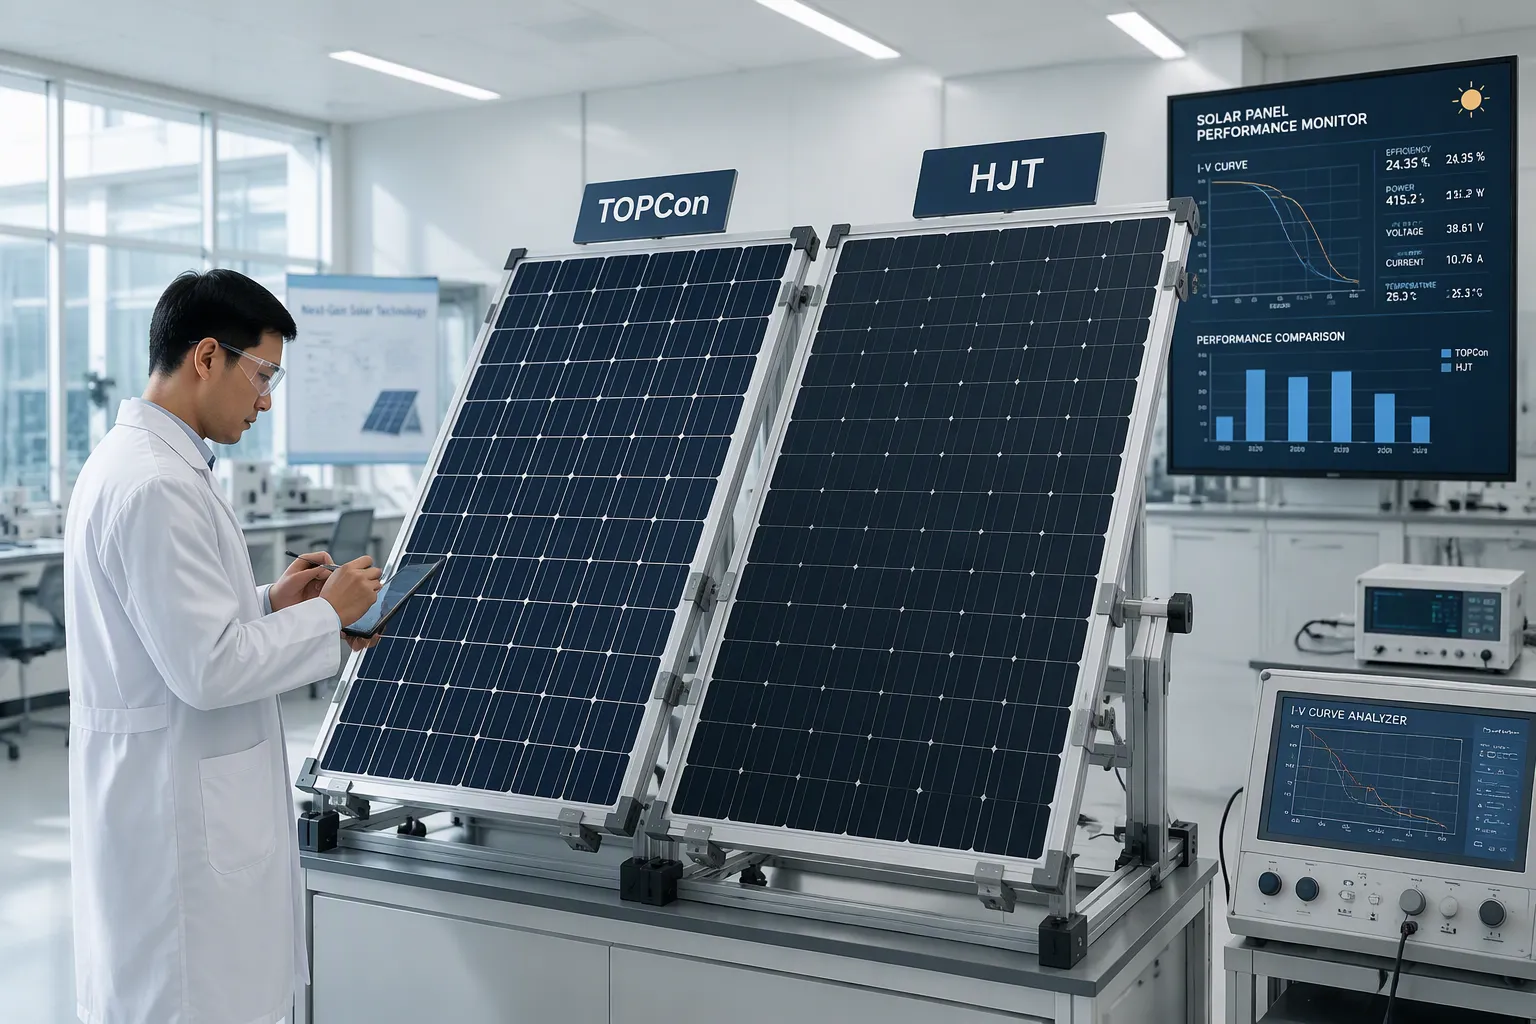
    HJT leads on efficiency and temperature performance, with coefficients of -0.20% to -0.30% per degree Celsius. N-Type TOPCon, at -0.26% to -0.30%, offers mature, cost-effective mass production. This N-Type TOPCon vs HJT Solar Panels comparison weighs performance, degradation, cost, reliability, and application fit. Both are viable N-type architectures. Treat this as a decision tool, not a verdict.   Key Takeaways HJT panels offer higher efficiency and better heat performance, but they cost more. TOPCon panels are more affordable and widely available, making them a practical choice for many projects. Your project's climate, space, and budget will determine which technology is the best fit.   Why N-Type Leads the Next Solar Cycle N-Type vs P-Type in Brief The silicon wafer sets the foundation. P-type wafers carry boron as the dopant. N-type wafers use phosphorus instead. That single material choice drives most of the performance gap between the two families. P-type silicon forms boron-oxygen complexes under sunlight. This light-induced degradation (LID) cuts initial output by 1%–3%. N-type silicon contains no boron, so it largely avoids LID. N-type cells also resist potential-induced degradation (PID) better. You get a more stable module from day one.   Buyer Benefits of N-Type Modules The gains show up in real numbers. Top N-type TOPCon and HJT modules reach 23%–24% conversion efficiency. Top P-type Mono PERC modules sit at 21.5%–22%. That 1%–2% edge means more power from the same roof or land area. Heat matters too. N-type temperature coefficients run -0.29% to -0.32% per degree Celsius. P-type runs -0.34% to -0.37%. On a 55°C summer day, the N-type module keeps more of its rated output. Field data confirms this: N-type TOPCon delivers 8% more peak summer output per kW and retains 91% of output at 60°C versus 87% for P-type. Over 25 years, modeled energy per kW runs 11% higher. First-year degradation stays below 1%, compared with 2.1% for P-type. You collect more kilowatt-hours across the whole warranty period.   N-Type TOPCon vs HJT Solar Panels: How They Are Made TOPCon's Mass-Production Maturity TOPCon is the most widely adopted N-type technology in mass production today. The numbers show why. By 2025, TOPCon capacity is projected at roughly 800–900 GW, against about 70–100 GW for HJT. In 2024, TOPCon's share of global new solar panel installations is expected to exceed 60%. Market share: 65–80% for TOPCon, 8–12% for HJT Mass-production line status: full mature for TOPCon, new line required for HJT Market position: lowest LCOE utility for TOPCon, premium high yield for HJT The process flow explains this scale. TOPCon adds a thin tunnel-oxide and doped polysilicon passivation layer to a PERC-style cell. Roughly 70–80% of TOPCon capacity comes from upgraded PERC lines. You get higher output without building a new fab, so supply is broad and lead times stay short.   HJT's Thin-Film Structure HJT solar cell technology takes a different route. The cell sandwiches a crystalline silicon wafer between thin amorphous silicon layers. This structure passivates the surfaces well and needs fewer process steps at high temperature. That design also demands new production lines. You cannot retrofit an existing PERC line easily, so HJT capacity stays smaller and carries a premium price. The payoff is a higher-efficiency cell with strong temperature behavior. When you weigh N-type TOPCon vs HJT, the manufacturing base is the clearest divider: TOPCon wins on availability, HJT on ceiling performance.   Efficiency and Temperature Performance Cell and Module Efficiency Ranges HJT sits at the top of the efficiency ladder. Cell efficiencies reach 25.5–27%, and module efficiencies land at 23–25%+. TOPCon cells run 24–26%, with modules at 22–24%+. The gap narrows once you move from cell to module. Technology Cell Efficiency Module Efficiency N-Type TOPCon 24–26% 22–24%+ N-Type HJT 25.5–27% 23–25%+ That difference translates into roughly one percentage point at module level. On a space-limited roof, the extra point means more kilowatts from the same area. On an open field, it matters less.   Temperature Coefficient and Bifacial Gain Heat is where HJT pulls ahead again. HJT carries a temperature coefficient of about −0.24 to −0.26% per degree Celsius. TOPCon sits near −0.29% per degree Celsius. HJT also performs well in low-light conditions. Technology Temperature Coefficient (Pmax) N-Type TOPCon ~−0.29%/°C HJT ~−0.24 to −0.26%/°C These values vary by manufacturer and product generation. Still, the pattern holds: HJT loses less output as panels heat up. For hot climates, that behavior supports stronger daily yield. TOPCon remains a solid performer, and its naturally higher bifaciality factor helps in snowy or sandy sites. HJT works well in bifacial designs too, capturing reflected light from the ground. Both technologies support bifacial configurations, so match the choice to your site conditions.   Degradation and Long-Term Reliability Annual Degradation Rates Output falls a little every year, and the rate compounds over the life of the array. HJT degrades more slowly than TOPCon. Published figures put HJT at roughly 0.25–0.40% per year and TOPCon at roughly 0.35–0.50% per year. Technology Annual Degradation Rate 25-Year Capacity Retention N-type TOPCon 0.35–0.50% per year 89.4–91.2% N-type HJT 0.25–0.40% per year 90.5–92.8% The gap looks small on paper. It adds up across decades of production. At year 25, a TOPCon module typically holds 87–89% of its original output, while an HJT module holds 90–92%. By year 30, the figures read 85–87% for TOPCon and 89–91% for HJT. On a large project, those percentage points become real megawatt-hours and real revenue. Both technologies still beat P-type by a wide margin. N-type panels degrade roughly 30–50% less than P-type panels. That advantage delivers about 5–7% more energy yield over 25 years.   Warranty and Bankability Signals Warranty terms tell you how confident a manufacturer feels about its product. TOPCon suppliers commonly back their modules with a 30-year linear performance warranty and a Zero LID guarantee. That combination satisfies bank and NBFC lender bankability requirements, which matters when you finance a project. Certification adds another layer of assurance. TOPCon products hold ALMM eligibility and BIS certification. Major manufacturers continue to invest in TOPCon capacity, and that commitment supports long-term parts and service availability. HJT matches or exceeds TOPCon on efficiency, yet it requires new and expensive production equipment. Treat warranty length and lender acceptance as signals of bankability, not as a ranking. Ask each supplier for written terms before you commit.   Side-by-Side Comparison   You now have the individual pieces. This table puts them in one place, so you can weigh the trade-offs at a glance. Every figure below comes from published product data and market pricing. Treat the ranges as indicative, not as fixed specifications. Feature N-Type TOPCon N-Type HJT Manufacturing maturity Very mature; widespread capacity, domestic supply under ALMM/DCR Rapidly growing; limited domestic supply Module efficiency (STC) 22–24%+ 23–25%+ Temperature coefficient −0.29%/°C −0.24 to −0.26%/°C Bifaciality factor Higher bifaciality factor Compatible with bifacial designs Year-1 degradation ~1% ~1% Linear annual degradation 0.35–0.50%/year 0.25–0.40%/year Indicative cost (India, 2026) ₹24–26/Wp ₹28–32/Wp Read the rows as trade-offs, not as scores. HJT wins on module efficiency, temperature coefficient, bifaciality, and annual degradation. TOPCon wins on manufacturing maturity and cost per watt. Year-1 degradation is effectively a tie at about 1% for both. The cost row deserves context. HJT carries a premium of roughly ₹4–6 per watt-peak over TOPCon in the Indian market. That premium buys you a higher-efficiency module, a lower temperature coefficient, and slower long-term degradation. Whether the premium pays back depends on your climate, your available area, and your financing terms. The maturity row matters for procurement risk. TOPCon supply is widespread and includes domestic capacity that meets ALMM and DCR requirements. HJT domestic supply remains limited, so lead times and sourcing options are narrower. No universal winner exists in this N-Type TOPCon vs HJT Solar Panels comparison. A project in a hot climate with high land costs may justify the HJT premium. A large utility or commercial project with tight capital budgets often favors TOPCon. Use the table to frame your own calculation, then test both options against your site data.   Energy Yield in Real Conditions Hot and High-Irradiance Climates Heat separates these two technologies more than any lab rating does. HJT holds a temperature coefficient of -0.24% to -0.26% per degree Celsius. TOPCon runs -0.29% to -0.32%. That gap changes real output once cell temperatures climb. Metric N-Type TOPCon HJT Power loss at 65°C cell temperature 11.6–12.8% 9.6–11.2% Weighted annual temperature loss ~5.9% ~5.3% Performance ratio ~91% ~92% A 10 kW system in Tunis shows how this plays out. TOPCon produces about 18,400 kWh per year. HJT reaches roughly 18,650 kWh, a gain of 250 kWh or 1.4%. Compare both against PERC and the N-type advantage grows clearer: TOPCon adds about 800 kWh per year (4.5%), while HJT adds about 1,050 kWh (6.0%). In hot climates, N-type TOPCon panels outperform P-type PERC by roughly 4-5% in annual energy yield under North African and Middle Eastern conditions, while HJT panels add another 1-2% — but at a notably higher price. That premium runs 15-30% over TOPCon. Weigh it against a 1.4% yield gain before you commit.   Space-Contrained and High-Albedo Sites Bifacial gain rewards sites with bright, reflective ground. TOPCon vs HJT bifaciality favors HJT slightly, and bifacial solar module performance depends on albedo, mounting height, and tilt as much as on the cell. Snow, white gravel, and light concrete lift rear-side output for both technologies. On a tight roof, every square meter counts. HJT's higher module efficiency packs more watts into the same area, so TOPCon vs HJT energy yield tilts toward HJT when area is the binding limit. On open land, HJT vs TOPCon power output differences shrink in importance, and installed cost dominates the decision. Match the module to the site. Measure albedo and roof area first, then compare the two options on lifetime kilowatt-hours.   Cost, ROI, and Levelized Cost of Energy Upfront Cost vs Lifetime Value Money talks first. TOPCon modules run roughly $0.25–$0.35 per watt. HJT carries a 10–20% premium, and that gap is narrowing as production scales. The factory side explains the spread. Converting a PERC line to TOPCon costs about $30–40 million per GW per year. HJT needs an entirely new facility at $80–120 million per GW for low-temperature deposition equipment. Panel Type Initial Cost ($/W) 25-Year LCOE N-Type TOPCon $0.30 $0.038/kWh N-Type HJT $0.35 $0.036/kWh Notice the reversal. HJT costs more today, yet its 25-year LCOE comes in lower. That is the heart of any TOPCon vs HJT cost analysis. A 5 MW commercial system shows the same pattern. Choosing TOPCon at $0.30/W over PERC at $0.22/W adds about $400,000 to the initial bill. That system then generates $1.2–1.6 million more in lifetime energy over 30 years. Solar module lifecycle cost rewards patience, not the lowest quote.   When Higher Efficiency Pays Back Site conditions decide whether the HJT premium earns its keep. In hot climates, HJT produces 5–8% more annual energy. That gain narrows the upfront gap and lowers LCOE by 12–18% over 25 years. A normal-sized rooftop tells a different story. A homeowner in Indore or Bhopal rarely recovers the HJT premium. A typical residential TOPCon premium justifies itself in about 9 years, within a 25-year system life. The HJT premium takes roughly 12 years. Run a TOPCon vs HJT ROI model on a space-constrained roof or a premium build, and the economics shift toward higher efficiency. Where space is not a constraint and upfront cost matters, the cheaper option wins. Match the module to the constraint that binds your project.   Matching Technology to Your Project Scenario Guide by Climate and Budget Start with your climate. Extreme heat with summers above 95°F rewards HJT, which balances efficiency and heat tolerance when space is tight. A hot site with limited roof area also favors HJT, TOPCon, or premium N-type options, because high efficiency plus good temperature behavior maximizes power per square foot. When space is ample, HJT remains a strong pick for long-term output. Humidity and salt air change the picture. Coastal and hot-humid sites suit HJT, which resists moisture-related degradation. Budget-focused hot climates lean toward TOPCon. It delivers strong heat performance, and its cost keeps improving as production scales. Commercial buildings with aesthetic demands call for premium N-type products with uniform black appearance and 30-year warranties. Your budget sets the second filter. A tight capital budget points to TOPCon for large-volume deployment. A premium budget opens HJT for maximum yield. Neither choice is wrong. Each fits a different constraint.   Project-Type Recommendation Table Project type narrows the decision further. The table below maps each technology to its best-fit applications. Technology Best-Suited Project Types N-Type TOPCon Utility-scale plants; C&I rooftop projects; large-volume deployment; ROI and LCOE-focused projects; ground-mounted bifacial projects HJT High-temperature regions; desert projects; snow or high-reflection environments; premium utility-scale projects prioritizing maximum energy yield TOPCon also covers industrial and manufacturing plants, agricultural solar, solar-plus-storage hybrids, commercial rooftops, and EPC turnkey work. Wattage class guides the match. Modules at 550W–600W suit distributed generation on commercial rooftops and small industrial systems. The 600W–650W band fits C&I systems and EPC contracts. Large C&I rooftops and industrial parks take 650W–700W. Utility plants use 700W–720W, and gigawatt-level projects run 720W and above. Use this N-Type TOPCon vs HJT Solar Panels framework as a starting filter. Confirm the final choice against your site data, your tariff structure, and your financing terms.   Procurement Checklist for N-Type Modules Datasheets, Certifications, and Warranty Terms Start with a solar module datasheet comparison across shortlisted products. Verify the module efficiency, bifacial factor, temperature coefficient, and year-one and annual degradation figures. Set clear thresholds: module efficiency of at least 23.5%, a bifacial factor of at least 85%, and warranty terms of at least 80% output at 30 years. Run a solar panel degradation rate comparison and a solar module warranty comparison side by side, then feed the TOPCon-specific parameters into your energy-yield model for accurate LCOE results. Confirm certifications and test reports in writing. Ask for PID resistance data, damp-heat and salt-mist results where your site demands them, and proof of eligibility for your destination market. A single sample cannot represent every production batch, so pair the sample with batch-level quality-control records.   Evaluating an N-Type TOPCon Supplier Judge a TOPCon solar module supplier on evidence, not on sales presentations. Check factory capacity, production records, and quality-control procedures. Confirm warranty terms, replacement procedures, and response times in writing, and tie payment milestones to inspection and shipping documents. Ask whether the N-type solar module manufacturer has shipped to your market before, since paperwork errors can delay shipments for weeks. Supplier Profile Annual Module Capacity Warranty Structure Key Buyer Checks Profile A 30–50 GW 12–15 yr product; up to 30 yr performance Bankability, serial-number traceability Profile F 10–25 GW 12–15 yr product; 30 yr options Damp-heat data, salt-mist testing Suppliers compete on equal terms, and selection rests on fair evaluation of quality, price, delivery, after-sales service, and stable supply. Weigh installation conditions, spare inventory, and local technical skills alongside efficiency ratings. This checklist applies to any solar panel technology for utility-scale projects, and it matters just as much in the N-Type TOPCon vs HJT Solar Panels decision.   PNG Solar's N-Type TOPCon Solutions Fit Across Utility, C&I, and Distributed Projects PNG Solar builds its N-Type TOPCon line around the three project types this article has already mapped. Utility-scale plants take the high-wattage modules, where cost per watt and bankability drive the decision. Commercial and industrial rooftops sit in the middle bands, and those sites reward a balance of efficiency and upfront price. Distributed projects, including residential and small industrial systems, use the lower wattage classes. You can match a module to your project without guesswork. The 550W–600W class suits distributed generation on commercial rooftops and small industrial systems. The 600W–650W band fits C&I systems and EPC contracts. Large C&I rooftops and industrial parks take 650W–700W, while utility plants use 700W–720W and above. Each product page lists the application scenarios for that class, so you can confirm the fit before you shortlist.   Samples, Datasheets, and Inquiry Pathways Request the datasheet first. Check module efficiency, bifacial factor, temperature coefficient, and the year-one and annual degradation figures against the thresholds set out in the procurement checklist above. Ask for batch-level quality-control records alongside the sample, since one sample cannot represent every production run. Three inquiry routes keep the process simple. Ask for a datasheet pack to compare specifications across wattage classes. Request a sample for inspection and testing. Send your project details, including site location, climate, available area, and budget, to receive a project-specific recommendation. Share your timeline as well, so the team can confirm lead times against your schedule.   HJT wins on efficiency, slower degradation, and heat performance when your budget allows. TOPCon wins on proven cost-effectiveness, mass-production maturity, and broad project fit. Your climate, land or roof area, budget, financing requirements, and timeline decide the better option. This N-Type TOPCon vs HJT Solar Panels choice has no universal winner. Request datasheets or a project-specific recommendation to finalize your pick.   FAQ How big is the efficiency gap between TOPCon and HJT? Expect roughly one percentage point at module level. HJT modules reach 23–25%+, while TOPCon modules land at 22–24%+. The gap widens on cell ratings and narrows once panels are assembled. Which technology degrades more slowly over 25 years? HJT holds output better. Published rates put HJT near 0.30% per year and TOPCon near 0.40% per year. By year 25, that difference becomes measurable megawatt-hours on a large array. Is HJT worth the higher price per watt? It depends on your site. HJT carries a premium of roughly ₹4–6 per watt-peak in India. Choose it when heat, limited area, or high land costs make extra yield valuable. Otherwise, TOPCon usually wins on payback.
  • 700W Solar Panel Technology Explained: Are Ultra High Power Modules Ready for Utility Projects?

    700W Solar Panel Technology Explained: Are Ultra High Power Modules Ready for Utility Projects?

    Oct 16, 2026
    Yes, 700W solar panel modules are ready for utility-scale projects. N-type TOPCon and HJT architectures, plus 210mm wafers, drive this shift. Readiness rests on three pillars: mature efficiency near 22.5%, balance-of-system savings, and real deployment data. This 700W Solar Panel Technology Explained analysis asks whether ultra high power solar module demand is durable or a temporary peak. Each high watt solar panel manufacturer now competes on bankability, tracker fit, and inverter matching.   Key Takeaways 700W solar panels use advanced N-type cells and larger wafers to reach about 22.5% efficiency. These panels cut balance-of-system costs by 5-10% and improve energy output per dollar. Check tracker compatibility and choose tier-1 manufacturers for reliable utility-scale projects.   700W Solar Panel Technology Explained: What Makes It Possible? A 700W module delivers roughly 700 watts under standard test conditions. Industry-leading products reach about 22.5% efficiency at this power class. This 700W Solar Panel Technology Explained section covers the cell architectures and wafer formats behind that performance.   N-Type TOPCon and HJT Cells Most current 700W and 750W modules use N-type TOPCon or HJT cells. Older PERC architectures cannot reach this power class. Cell-level efficiency for these N-type technologies ranges from 25.5% to 27%. Full module specifications land between 22% and 25% after accounting for packing losses.   Cell Technology / Context Efficiency Range N-Type TOPCon and HJT (700W+ modules) 25.5%–27% Typical 700W solar panel specifications (N-Type TOPCon or HJT) 22%–25%   The two technologies differ in durability. HJT holds a temperature coefficient of −0.24%/°C. TOPCon sits at −0.30%/°C. Both lose about 1% in year one. HJT then degrades roughly 0.30% per year on a warranted basis, while TOPCon runs at 0.40% per year. N-type cells generally degrade slower than PERC, which carries 0.45%/year.   210mm Wafers and Higher Operating Currents The 210mm wafer format unlocks the 700W power class. A 132-cell layout on this format provides the irradiated area and electrical conditions the module needs. A 700W solar panel typically operates at currents around 17–18 A. Feature M10 (182mm sq.) G12 (210mm sq.) G12R (182×210mm) Wafer Area 274 cm² 440 cm² 382 cm² Module Power (TOPCon) 560–590 W 670–720 W 620–700 W Inverter Current Req. 15–16A MPPT 16A+ MPPT (essential) 15–16A MPPT The G12R format captures the key benefit of G12 — the 210mm dimension delivering higher power per cell — while retaining the 182mm dimension that keeps module width at roughly 1,134mm. Higher power output per cell results from the larger active area. The passivated contact structure of TOPCon keeps losses relatively low under high-current conditions. PERC modules are more susceptible to series resistance and LID/PID effects at these currents.   Utility Benefits: BOS Savings and LCOE Gains Project economics decide whether any module class reaches utility scale. A 700W solar panel changes the cost structure of a plant before a single megawatt-hour is sold. This section stays at the project level and leaves cell physics to the previous discussion. Lower Balance-of-System Costs Fewer modules per megawatt drive the savings. A 700W module needs roughly 30% fewer units than a 550W module to build the same array capacity. That reduction cascades through the entire bill of materials. Typical balance-of-system savings land between 4% and 6% per megawatt. The gains come from three sources. Mounting hardware shrinks because fewer clamps, rails, and foundations are required. DC wiring drops because fewer strings need combiner runs. Labor hours fall because installers handle fewer pieces per megawatt. A 100 MW project built with 700W modules instead of 550W modules avoids handling roughly 39,000 module units, with proportional reductions in clamps, connectors, and cable runs. Sustainability claims reinforce the procurement case. Silicon PV panels generate 7.2x to 11.4x more energy than is required to produce them. Fewer modules per megawatt also mean less material shipped, mounted, and eventually recycled.   Improved LCOE and Inverter Matching Higher operating currents improve inverter matching. A 700W solar panel runs at roughly 17–18 A, and G12-format products require 16A+ MPPT channels. That higher current lets a given inverter capacity support a larger DC-side array. Developers can raise the DC-to-AC ratio without adding inverter blocks. The result is better utilization of existing inverter hardware and a lower cost per kilowatt-hour. The levelized cost of energy improves through both channels. Lower BOS spending reduces upfront capital cost. Better inverter utilization raises energy yield per dollar of power electronics. Together, these effects push LCOE down at the plant level. Supply-side competition matters here too. Every high watt solar panel manufacturer now scales TOPCon and HJT lines, and that capacity pressure steadily narrows the price gap between 700W and 550W products. An ultra high power solar module therefore competes on total installed cost, not on nameplate wattage alone. Developers should model BOS savings and inverter matching together, because the two effects compound across a full utility-scale build.   700W vs. 550W/600W Modules: A Data Comparison Efficiency, Degradation, and Temperature Coefficients The efficiency gap between module classes is measurable. A 700W solar panel reaches roughly 22.5% efficiency. Mainstream 550W and 600W products sit between 20.4% and 21%. The 400W utility-scale baseline, long the incumbent reference point, also lands near 20.4%. That spread means a 700W module converts more of the same sunlight into usable power within an identical footprint. Metric 700W Class 550W/600W Class 400W Baseline Module efficiency ~22.5% 20.4%–21% ~20.4% Annual degradation 0.30%–0.40% ~0.45% (PERC) ~0.45% (PERC) Temperature coefficient −0.24% to −0.30%/°C ~−0.35%/°C ~−0.35%/°C Degradation and temperature behavior favor the higher power class. N-type cells lose 0.30% to 0.40% per year, while PERC products degrade at roughly 0.45% per year. HJT holds a temperature coefficient of −0.24%/°C and TOPCon sits at −0.30%/°C. Older PERC modules run near −0.35%/°C. Hot sites therefore retain more output with N-type products.   Cost per Watt and BOS Impact Cost per watt narrows as production scales. Every high watt solar panel manufacturer now runs TOPCon and HJT lines, and that capacity pressure compresses the premium once attached to 700W products. The larger economic effect sits in balance-of-system spending. A 700W module needs roughly 30% fewer units per megawatt than a 550W module, which cuts clamps, rails, connectors, and cable runs. Typical BOS savings land between 4% and 6% per megawatt. An ultra high power solar module thus competes on total installed cost rather than nameplate wattage alone.   Real-World Deployment and Applications Utility-Scale, C&I, and Agricultural Use Cases Deployment data now covers all three major segments. Utility-scale farms form the largest share, where the ultra high power solar module class supports multi-hundred-megawatt builds. Commercial and industrial rooftops and ground mounts follow, because these sites need large-scale power generation within limited footprints. Agricultural operations represent a growing third category. Farms pair 700W arrays with irrigation pumps, grain drying systems, and cold storage. The high power density reduces the number of mounting points across barn roofs and field racks. Tracker Compatibility and Installation Considerations Trackers rated for 550W–600W modules may need review before accepting 700W products. Higher operating current pushes against the limits of module-level junction boxes and bypass diodes. It also raises resistive losses and thermal loading, which requires heavier conductors, thicker DC cables, and higher-rated DC components. Equipment options narrow, and late-stage substitutions become more likely. Mechanical loads demand equal attention. Longer and wider modules alter load distribution across tracker rows under wind and snow. Bending moments shift at mounting points and frames. Reinforced frames or structural upgrades may be necessary, and heavier assemblies need different handling and lifting plans.   Issue Category Specific Compatibility Impact Higher Current Pushes junction box and bypass diode limits; requires heavier conductors and higher-rated DC components Mechanical Loads Alters load distribution; shifts bending moments; may require reinforced frames or structural upgrades Tracker Margins Performance margins narrow as modules extend beyond familiar envelopes Mechanical penalties tend to accumulate quickly once dimensions push beyond established norms. Formats that remain closer to familiar envelopes generally simplify engineering review and reduce uncertainty as projects move from design into construction. Choosing the Right Ultra-High-Power Module Bankability and Supply Chain Maturity Module selection starts with the supplier, not the datasheet. A high watt solar panel manufacturer with tier-1 status carries the financial weight that lenders and insurers require. Tier-1 firms are vertically integrated, produce their own wafers, cells, and modules, and hold at least five years of operational history. Tier-2 assemblers buy cells from other suppliers. Tier-3 firms lack vertical integration and carry less than two years of history. Tier-1 panels typically cost 10–20% more, yet they deliver stronger warranty support and long-term reliability. Criterion What to Check Minimum Standard Bankability Bloomberg Tier 1 status, financial health Tier 1 (Bloomberg NEF) Module efficiency Nameplate efficiency vs. area ≥21.5% (N-type TOPCon) Warranty terms Product and performance warranty 25yr product / 30yr performance Temperature coefficient Power loss per °C above 25°C ≤−0.30%/°C Certifications IEC 61215, IEC 61730, UL 61730 All required for your market Local service Local office, warranty claim process Within 48hr response time The gap between a laboratory record and a bankable product is enormous. Scaling production demands uniform coating across millions of square meters, consistent quality control, and a supply chain for materials that barely existed two years ago. Investors require 25-year performance warranties and insurers willing to back the technology. That is why the solar industry adopts breakthrough designs slowly.   Matching Technology to Project Conditions Site conditions decide which module class fits. High-temperature sites favor HJT, which holds a temperature coefficient of −0.24%/°C, while TOPCon sits at −0.30%/°C. Low-irradiance sites benefit from N-type low-light performance. Tracker configurations need review, because higher currents push junction box and bypass diode limits. Developers should determine required DC capacity first, then compare module dimensions and efficiency relative to area. Limited space favors higher power density. Commercial rooftops favor the 700W class, which handles more easily than larger formats. The efficiency trajectory continues beyond 700W. Perovskite-silicon tandem cells have exceeded 30% in the laboratory, opening a commercialization pathway toward higher-efficiency solar cells. The Shockley-Queisser limit sets a theoretical ceiling near 33% for single-junction cells, so 700W represents one step on a longer curve.   700W solar panel modules are mature and economically compelling for utility projects, yet they are not a universal drop-in replacement. Tracker ratings, site conditions, and financing terms determine the best choice. N-type TOPCon and HJT efficiency near 22.5%, 4–6% BOS savings, and improved inverter matching support deployment. Perovskite tandem cells exceeding 30% in the lab signal continued gains, but 700W remains the current sweet spot. Developers should pilot ultra high power solar module units on suitable projects, validate performance data, and scale as supply chain confidence grows.   FAQ Are 700W modules compatible with existing trackers? Not always. Trackers rated for 550W–600W modules may need review. Higher currents push junction box and bypass diode limits, and longer frames shift mechanical loads. Do 700W modules cost more per watt? The premium is narrowing. Every high watt solar panel manufacturer now scales TOPCon and HJT lines. A 700W solar panel competes on total installed cost, not nameplate wattage. Is 700W the final efficiency ceiling? No. Perovskite-silicon tandem cells have exceeded 30% in the laboratory, with a pathway toward higher efficiency. The Shockley-Queisser limit near 33% still caps single-junction silicon. An ultra high power solar module remains one step on that curve.
  • 太阳能电池板工厂审核清单:全球买家应该做什么

    太阳能电池板工厂审核清单:全球买家应该做什么

    Oct 14, 2026
    A 太阳能电池板工厂 审核是您在下单前确认产品质量、安全性和合规性的最可靠方式。您的太阳能电池板工厂审核清单应涵盖以下类别:质量管理体系生产工艺及设备材料和部件检验测试和认证道德和社会合规性物流和售后支持根据型号、工厂和订单情况定制核对清单。这样可以在发出询价单或形式发票之前,公平地比较供应商。 Pinergy的采购经验表明,结构化的检查清单可以防止代价高昂的错误,并确保供应商的长期可靠性。 要点总结太阳能电池板工厂审核清单可帮助您在下单前确认质量、安全性和合规性。检查测试和认证文件,确保面板符合标准并能长期保持良好性能。核实道德规范和售后支持,以保护您的品牌并获得可靠的服务。 太阳能电池板工厂审核清单:质量和生产质量管理和生产流程是工厂可靠性的基础。如果这方面的体系薄弱,就会影响您执行的其他所有检查。因此,您的太阳能电池板工厂审核清单必须同时验证已记录的体系及其在实际运行中的执行情况。质量管理体系首先要进行 ISO 9001 认证。确认认证范围涵盖太阳能电池板制造,而不仅仅是贸易或组装。索取质量手册,它相当于工厂的章程。手册概述了组织架构、质量目标以及原材料接收、设备校准和不合格产品隔离等方面的标准操作规程 (SOP)。根据 ISO 9001:2015 标准第 9.2 条,内部审核必须经过计划、记录并保持独立性。该标准要求每六个月进行一次内部审核,以验证质量管理体系的有效性。请索取审核计划、审核结果和审核结束记录。由经认可的第三方注册机构进行的严格的两阶段审核,不仅评估文件记录,还评估体系在日常运营中的有效运行情况。不合格产品的处理需要密切关注。ISO 标准并不要求完美,而是要求建立一套纠正缺陷的系统。纠正和预防措施日志记录了每一个内部错误或客户投诉、进行的根本原因分析以及实施的永久性生产变更。核实独立的质量控制人员是否向外部生产管理人员报告。检查可追溯性系统,确保模块序列号与生产订单、电池批次和供应商关联起来。这支持 中国太阳能供应商验证 并保障您的保修索赔。 生产工艺及设备沿生产线巡视观察。对于穿线和贴片工艺,审核员会检查自动穿线机的温度、张力和时间参数。常见的不合格项包括冷焊、带材错位和焊后单元微裂纹。对于真空层压工艺,检查配方和真空曲线。注意是否存在气泡、EVA固化不足或过度固化、分层和单元移位等问题。设备校准状态至关重要。太阳能模拟器需要使用可靠的内部参考模块进行每日验证。请确认串线器、层压器、框架器和测试仪的校准记录。审查工艺流程图、AOI 和 EL 测试站以及维护日志。温度、湿度和粉尘的环境控制可保护材料的完整性。员工培训记录表明操作人员理解标准操作规程 (SOP) 和黄金配方。Pinergy 建议对每个项目进行客观评分,以便在比较供应商时做到公平公正。 太阳能工厂审核. 材料、测试和道德合规性材料和部件检验材料质量决定了面板的最终性能和使用寿命。 太阳能电池板工厂审核清单 因此,必须对电池、玻璃、封装材料、背板、框架和接线盒进行来料检验。所有材料在进入生产前都应遵循一套书面验收程序。工厂通常采用基于 ISO 2859-1 的抽样方案,并在其 ERP 系统中将材料标记为合格 (OK)、暂扣 (Hold) 或不合格 (Reject)。电池、封装材料、背板、色带、密封剂和助焊剂等关键材料需要在 AQL 1 级进行检验。色带、铝框架和接线盒需要进行身份检查,并标记为合格 (OK)、暂扣 (Hold) 或不合格 (Reject)。不合格材料将进入库存,并触发相应的书面纠正措施。电池检测至关重要。每块电池都要经过校准的太阳能模拟器,测量其在最大功率点的电流和电压。操作人员检查电池外观,进行电致发光成像以检测微裂纹和失效区域,并将每块电池分拣到相应的功率等级。印刷几何形状、涂层质量、表面污渍和边缘尺寸均需进行筛选。对于EVA封装膜等对湿度敏感的材料,储存条件至关重要:需核实温度和湿度控制、保质期管理以及卷材防堵塞措施。核对物料清单(BOM)与实际组件,并确认材料符合已记录的验收标准。 测试、认证和道德合规认证证明面板符合安全和性能标准。设计认证标准为地面平板组件提供型式认可。安全认证标准涵盖触电、火灾隐患和机械应力预防。北美安全和性能标准也适用。典型的认证程序需要相当长的时间,并且需要一组组件样本进行测试。内部测试是对认证的补充。务必确认每个生产批次都经过闪光测试、电致发光测试、绝缘测试和湿泄漏测试。太阳能模拟器的校准证书至关重要。缺少闪光测试数据是一个危险信号,应立即拒绝该供应商。独立检验是对制造商验证和认证检查的补充,为您提供公正的数据。 中国太阳能供应商验证.遵守道德规范能够维护您的品牌声誉。请索取社会责任审计报告、工资记录、安全规程、环境许可证和废物处理程序。这些文件能够揭示工厂是否以负责任的方式运营。一份详尽的审查报告至关重要。 太阳能工厂审核 综合考量所有这些维度,确保您 太阳能制造商质量控制 标准在你面前经得住考验 从中国订购前请先核实. 物流、售后服务和检查清单的使用物流和售后支持你的 太阳能电池板工厂审核清单 必须在集装箱离港前核实包装标准。受损的组件外观通常完好无损,内部电池片的裂纹会在之后显现。检查托盘强度、护角和防潮层。确认垂直包装箱的重量压在铝制框架上,这样可以保护电池片免受运输过程中的震动。根据行业研究,运输过程中的振动和不当操作造成的微裂纹会导致模块在其使用寿命期间出现明显的功率下降。使用保护性泡沫缓冲材料和耐用打包带。确认托盘采用热处理木材。检查是否使用了干燥剂并完成了收缩膜密封。这些细节有助于降低索赔风险。售后支持同样需要仔细审查。太阳能保修通常包括产品保修和长期性能保证。务必明确索赔流程、响应时间和备件供应情况。询问当地是否有备件库存。对于商业阵列,标准索赔可能需要相当长的时间。您的项目可能需要更快的响应速度。在供货合同中明确规定时间安排。审查经审计的财务报表、保修准备金和保险范围。确认供应商在您的市场拥有服务能力。索取生产历史和参考安装案例。同时确认供应商在目的地国家/地区的进口法规方面的经验。 使用太阳能电池板工厂审核清单使用评分系统对供应商进行比较。根据您的风险承受能力和订单量确定优先级。首先进行远程审核,然后进行现场审核。要求供应商针对每一项不符合项提供纠正措施计划。每六个月或生产发生变化时重新审核一次。发货前检验必须涵盖标记和可追溯性。核对序列号、型号代码和功率额定值与采购订单是否一致。检查原产国标签和物料清单配置。独立的第三方公司可提供公正的数据。 中国太阳能供应商验证.这些步骤可以增强你的 太阳能制造商质量控制 它们也是您计划的核心组成部分。 从中国订购前请先核实 协议。完整的 太阳能工厂审核 Pinergy 综合考量物流、单据和售后承诺,运用这种结构化的方法,帮助全球买家自信地采购,避免选择不合格的工厂。 您的太阳能电池板工厂审核清单是一个动态工具,会随着标准的更新而不断完善。清单涵盖质量管理、生产、材料、测试、道德规范和物流等类别,构成了一个完整的风险缓解框架。您可以根据自己的产品和市场进行定制。建议先从小批量订单的试点审核开始。Pinergy 团队使用类似的清单来确保采购的可靠性,并避免选择不合格的工厂。 常问问题太阳能电池板工厂应该多久审核一次?至少每六个月进行一次审核。工厂更换生产线、供应商或所有权时,需重新审核。大批量订单可能需要更频繁的审核。一份统一的太阳能电池板工厂审核清单可以跟踪工厂随时间发生的变化。太阳能工厂审核过程中最大的危险信号是什么?缺少闪光测试数据是首要问题。其他警示信号包括缺乏独立的质检人员、认证过期以及缺少整改记录。这些问题都表明太阳能制造商的质量控制薄弱。仅仅依靠第三方检验可以吗?不。第三方公司提供的数据虽然客观公正,但你仍然需要一份自己的核查清单。结合远程审核、实地考察和文件核查,可以强化你从中国订购商品前的“先核查再下单”策略。
  • 中国太阳能电池制造商对比

    中国太阳能电池制造商对比

    Oct 14, 2026
    读者应该了解宁德时代、比亚迪、派隆科技、阳光电源、华为和 Pinergy这份对比评测综合考虑了质量、价格、技术、保修和客户支持等因素。中国在全球太阳能电池生产中处于领先地位,因此这些制造商至关重要。本指南旨在帮助您根据家庭、企业或离网需求选择合适的制造商。 要点总结宁德时代和比亚迪凭借先进的技术和大规模生产引领市场。Pylontech 和 Pinergy 提供可靠的家用电池,并具有强大的保修和支持。购买前务必查看认证、保修条款和当地支持情况。 中国顶级太阳能电池制造商快速对比表下表总结了中国十大太阳能电池制造商。排名反映了2025年全球排名。 储能系统 如有发货数据,请提供。公司ESS单元供应商排名全球份额主要优势佳能#128.5%LFP 和钠离子细胞比亚迪#410.5%垂直整合加州#57.1%细胞供应合作伙伴关系Pylontech未排名无法使用住宅用液化石油气储罐阳光树未排名无法使用混合和商用系统华为未排名无法使用智能能源管理迪尼斯未排名无法使用小型家用电池好我们未排名无法使用逆变器-电池配对平均功率未排名无法使用利基OEM生产Pinergy未排名无法使用住宿支持重点比亚迪在2025年超越特斯拉,成为全球最大的电池储能系统(BESS)部署商。比亚迪的BESS出货量超过60GWh,而特斯拉的出货量为46.7GWh。阳光电源在系统集成商中排名第三,BESS业务贡献了其总收入的42%。宁德时代仍是最大的电池供应商,但其市场份额从2024年的29%下降到2025年的20%。 我们是如何评估它们的此比较采用五个标准。每个标准的重要性因买家的项目而异。产品质量涵盖电池化学成分、制造标准和安全认证。可靠的 中国锂电池供应商 基于运营的机构应明确记录其测试规程。价格反映了每千瓦时的初始成本和总拥有成本。磷酸铁锂电池的价格全面下降,这改变了消费者在比较经济型和高端产品时的计算方式。技术涵盖电池化学、放电深度、往返效率和智能功能。宁德时代(CATL)的钠离子电池研究和比亚迪的磷酸铁锂电池(LFP)改进代表了两条不同的技术路径。保修期限和条款差异很大。有些制造商提供十年保修,而有些则提供五年。保修文件本身往往能反映出公司对其产品的信心程度。客户支持涵盖响应速度、本地服务网络和技术文档。 中国储能系统制造商 总部设有区域办事处的公司通常能更快地响应保修索赔。榜单上的每家制造商都在这五个因素的不同组合上展开竞争。没有哪家公司能在所有标准上都胜出。正确的选择取决于买家更看重的是前期节省、长期可靠性还是本地支持服务。 宁德时代和比亚迪:市场领导者优点、缺点和最佳用途宁德时代和比亚迪是中国最重要的两家太阳能电池公司。这两家公司都对全球太阳能电池的价格和技术趋势产生着影响。它们各自采取不同的战略。宁德时代在磷酸铁锂电池和钠离子电池的研究领域处于领先地位。公司大力投资于下一代化学技术。钠离子电池有望降低成本并提升低温性能。宁德时代的规模优势使其在原材料供应商面前拥有强大的议价能力。其弱点在于对消费者的直接支持不足。公司主要服务于其他制造商,而非终端用户。比亚迪掌控着从电芯生产到成品电池组的整个供应链。这种垂直整合降低了成本,并提高了质量控制。比亚迪还通过电动汽车和储能项目拓展全球市场。该公司在2025年超越特斯拉,成为全球最大的电池储能系统(BESS)部署商。比亚迪的出货量超过60GWh,而特斯拉的出货量为46.7GWh。其高价位和复杂的产品线可能会让小型买家感到困惑。 公司2025年全球储能系统集成商市场份额比亚迪13%特斯拉10%阳光树9%中车株机6%佳能6%超强6%专家建议寻求尖端化学技术的买家应该关注宁德时代(CATL)。该公司在钠离子电池领域的进展可能在几年内重塑市场格局。然而,宁德时代最适合大型项目和OEM合作。普通用户很少直接与宁德时代打交道。比亚迪适合那些寻求成熟、一体化系统的买家。其全球服务网络能够很好地支持国际项目。比亚迪在车辆和储能领域的卓越业绩也赢得了客户的信赖。对于大多数商业和公用事业规模的项目而言,比亚迪提供更强大的整体解决方案。宁德时代依然是技术领先者,而比亚迪则提供更优质的端到端体验。 Pylontech、阳光电源和华为优点、缺点和最佳用途Pylontech 以其作为家用储能领域认证的磷酸铁锂电池供应商而闻名。该公司专注于家用储能系统的磷酸铁锂电池,其产品与大多数主流逆变器兼容。用户青睐其安装简便、性能稳定的特点。Pylontech 电池还拥有多项安全认证。其主要缺点是无法为大型商业项目提供全面支持。该公司主要面向家庭用户,而非公用事业规模的采购商。阳光电源和华为在商业和混合系统领域表现出色。阳光电源将逆变器与电池储能相结合,实现无缝能源管理。该公司在2025年全球系统集成商排名中位列第三。华为则通过其FusionSolar平台提供智能能源管理。这两个品牌都适合需要软硬件集成的企业。华为在某些市场面临网络安全方面的审查。一些国家已限制在关键基础设施中使用华为设备。这些地区的买家在购买前应了解当地法规。 专家建议Pylontech 适合希望购买性能可靠、价格实惠的电池的房主。该品牌最适合标准住宅安装。正在寻找可靠的中国锂电池供应商用于家庭用途的买家,应首先考虑 Pylontech。阳光电源适用于需要强大逆变器集成功能的商业项目。华为则更受注重智能监控和混合系统控制的买家青睐。然而,在华为产品受到限制的市场,买家应考虑阳光电源。两家公司都是商用太阳能电池领域的佼佼者。最终选择取决于当地法规和项目规模。 Pinergy 和其他新兴品牌优点、缺点和最佳用途Pinergy作为一家可靠的家用储能品牌而备受关注。业主可获得强大的客户支持,包括快速响应的技术支持和清晰的保修索赔流程。该公司专注于即插即用的电池系统,可与常见的混合逆变器配合使用。这种简便性吸引了那些希望获得可靠储能而无需复杂配置的用户。其主要局限性在于缺乏公用事业规模的经验。Dyness 和 GoodWe 占据中端市场,各具优势。Dyness 生产适用于狭小空间的紧凑型家用电池。GoodWe 则将其电池与自家逆变器配套使用,实现无缝连接。CALB 在全球储能系统 (ESS) 电芯供应中排名第五,但其电芯主要销售给制造商而非直接面向家庭用户。Avepower 专注于小众 OEM 生产,允许其他品牌对其电池组进行贴牌生产。定制电池项目需要不同的流程。像HBOWA NEW ENERGY这样的OEM厂商会根据买家的规格要求生产电池组。这些工厂负责电芯采购、电池管理系统(BMS)集成和成品包装。企业可以通过这种方式推出自有品牌的电池。定制订单通常需要更高的最低订购量。买家负责技术支持和保修服务。 专家建议对于重视可靠性和售后支持的住宅用户来说,Pinergy 是首选品牌。该品牌适合那些寻求可靠系统但又不想使用复杂工程技术的房主。与其选择本地支持薄弱但保修期更长的制造商,不如选择提供可靠保修和快速响应服务的品牌。细分市场需要量身定制的解决方案。Dyness 适合紧凑型住宅改造项目。GoodWe 适合已在使用其逆变器的项目。CALB 服务于原始设备制造商 (OEM) 和大型系统集成商。Avepower 适合寻求贴牌生产的品牌。买家正在比较…… 中国锂电池供应商 应索取细胞来源和细胞周期证明文件。 中国储能系统制造商 应提供逆变器兼容性数据。如果工厂没有区域办事处,买家还应从当地经销商处获得保修服务协议。 价格比较经济型、中档型和高端型中国太阳能电池的价格大致分为三个档次。经济型产品主要来自一些小众的OEM厂商和贴牌生产商。这些电池组的每千瓦时成本最低,但通常缺乏循环寿命测试数据。中档品牌如Pylontech、Dyness和GoodWe则在价格和安全性之间取得了平衡,并拥有经过验证的安全认证。比亚迪、阳光电源和华为等高端品牌的产品则需要更高的初始购买价格。消费者需要为集成软件、全球服务网络和更长的保修期支付额外费用。层级品牌示例典型的权衡取舍预算Avepower,白标OEM厂商前期成本更低,文档更精简。中档Pylontech、Dyness、GoodWe认证细胞,中等支持优质的比亚迪、阳光电源、华为集成系统,全球服务 磷酸铁锂电池价格全面下跌,这一趋势正在重塑消费者的决策。过去只能选择经济型电池的消费者,现在也能负担得起经过认证的中档电池组。电池价格的下降也缩小了不同档次电池之间的差距。 中国锂电池供应商 曾经只靠价格竞争的企业,现在必须在售后支持和文档方面展开竞争。 需要注意的隐性成本标价很少能反映出实际拥有成本。锂电池的运输需要危险品处理,这会增加运费。安装需要一位熟悉混合动力逆变器接线的合格电工。保修索赔可能需要将产品寄回工厂,而这笔费用通常由买方承担。一个 中国储能系统制造商 由于没有区域办事处,售后服务都由当地经销商负责。这些经销商会收取工厂从未报价的人工费。买家在下单前应索取到岸成本明细。务必索取书面形式的运费、安装费和保修服务报价。一款廉价电池加上昂贵的售后服务,十年下来往往比一款拥有本地支持的优质电池组更贵。 质量、技术和保修电池化学和循环寿命磷酸铁锂电池仍然是中国太阳能电池制造商的主流化学体系。钠离子电池已成为一种强有力的替代方案。宁德时代(CATL)的Naxtra电池单体能量密度为175Wh/kg,与主流磷酸铁锂电池相当。该公司还宣称,在GB 38031-2025认证下,其Naxtra电池可循环10000次以上,容量保持率达80%。特征磷酸铁锂(LiFePO₄)钠离子(Na+)能量密度(瓦时/千克)90–16070–160循环寿命(至 80% 容量)3,000–7,0002,000–5,000热失控温度>270°C>300°C-20°C 容量保持率75-85%85–92%原材料风险低(Fe、P、Li)极低(Na、Fe、Mn)钠离子电池具有显著的安全优势。钉刺测试显示,其峰值温升比同类锂电池低40-60°C。这种新型电池在寒冷气候下性能更佳,即使在-20°C的低温下也能保持较高的容量。此外,其灭火系统成本也降低了15-20%。由于钠、铁和锰等原材料储量丰富,因此原材料风险也随之降低。 保修和客户支持不同厂商的保修条款差异很大。Pylontech 提供 10 年保修,循环次数在 95% 放电深度下可达 6000 次。Sungrow 的保修期与 Pylontech 相同,并保证循环次数为 8000 次。比亚迪则规定循环次数为 6000 次,但未明确规定保修期限。品牌保修期限吞吐量/周期保证Pylontech10年6000次循环,95% DoD阳光树10年8000次循环比亚迪未指定6000次充放电循环买家应争取更有利的条款。以兆瓦时 (MWh) 为单位的吞吐量保证比简单的循环次数更有说服力。保证期末至少 70% 的容量保持率可以保护投资。制造商必须直接履行保证义务,而不是第三方安装商。一个 中国储能系统制造商 区域办事处处理索赔的速度更快。 中国锂电池供应商 由于缺乏本地服务,买家需要自行安排跨境运输。最终,响应速度远比一纸空文的承诺重要得多。 信任问题和买家怀疑质量与地缘政治风险一些买家,尤其是澳大利亚买家,质疑中国电池的质量是否能与西方品牌媲美。这些担忧通常源于早期价格低廉、资料不全的进口产品。如今,大多数主要制造商都持有国际安全认证,并公布循环寿命测试数据。信誉良好的制造商 中国锂电池供应商 运营方将根据要求提供细胞来源、检测方案和第三方审核报告。买家应将缺少文件视为质量问题的信号,而非质量低劣的证据。地缘政治风险对长期持有的影响更为微妙。贸易限制可能中断备件供应或延迟保修更换。如果制造商被排除在市场之外,现有客户可能无法获得固件更新或服务。政治敏感地区的买家应优先选择设有区域办事处和本地分销合作伙伴的品牌。 中国储能系统制造商 强大的本地化布局可以大大降低这种风险。 网络安全与数据安全智能电池可连接到应用程序、逆变器,有时甚至连接到电网本身。这种连接性引发了真正的安全隐患。Forescout 于 2025 年 3 月发布的 SUN:DOWN 研究报告列出了阳光电源 (Sungrow)、古瓦特 (Growatt) 和 SMA 设备中存在的 46 个新漏洞。路透社在 2025 年 5 月报道称,美国部署的中国制造的逆变器和电池内部存在未记录的蜂窝无线电模块。2024 年 11 月发生的 Deye 事件远程瘫痪了美国、英国和巴基斯坦的逆变器。该事件虽出于商业动机,但也展示了实时断电开关的功能。制造商已采取更强有力的安全措施予以应对。阳光电源与德国技术监督协会(TÜV SÜD)合作构建了“零信任”架构,并通过了ISO/IEC 27001认证。华为发布了逆变器安全白皮书,披露了核心技术参数。欧盟目前正在推广强制性EN 50178标准,该标准增加了认证门槛,并可能将测试周期延长三到六个月。买家在购买前应核实系统所拥有的认证。他们还应询问制造商是否允许本地数据存储以及是否允许进行独立的安全性审计。 哪些太阳能电池制造商的产品最符合您的需求?最适合家庭储能对于家庭用户来说,他们需要一款安装简便、兼容主流逆变器且提供本地支持的电池。Pylontech 正是这一类别中的佼佼者。该品牌以其经认证的家用储能磷酸铁锂电池而闻名,其 10 年质保和 6000 次 95% 放电深度循环寿命为消费者提供了明确的参考标准。此外,Pylontech 电池还兼容大多数主流逆变器,进一步简化了安装过程。Pinergy 位列第二。该公司专注于即插即用系统和响应迅速的售后服务。对于重视快速保修索赔的房主来说,Pinergy 可能比那些区域支持速度较慢的大品牌更合适。Dyness 适用于空间有限的房屋,而 GoodWe 则适用于已经使用其逆变器的住宅。正在为独栋住宅比较太阳能电池制造商的买家,在考虑公用事业规模的品牌之前,应该先将这四家公司列入考虑范围。 最适合商业和离网应用商业和离网项目需要更大的容量、更严格的认证和集成监控。比亚迪在该领域处于领先地位。其垂直整合涵盖从电芯生产到成品电池包的整个流程,并计划在2025年超越特斯拉,成为全球最大的电池储能系统(BESS)部署商,出货量超过60GWh。阳光电源位居第二,其产品涵盖逆变器和储能,预计将在2025年占据全球集成商市场9%的份额。在华为产品受限的市场中,买家应避免购买华为产品,而选择阳光电源(Sungrow)。偏远地区的离网用户也应考虑服务接入问题,因为远离区域办事处的电池组故障会造成实际的断网时间。除了知名品牌之外,其他认证的商用选择也十分丰富。GSL ENERGY 提供通过 UL9540、UL1973、IEC62619、CEI-021、UN38.3 和 CB/CE 认证的磷酸铁锂电池系统,产品涵盖 186 kWh、261 kWh 和 418 kWh 的储能柜,80–140 kWh 的高压储能柜,143–315 kWh 的液冷储能系统以及 50–80 kW 的一体化储能单元。该公司预计,到 2025 年年中,其产品将在 100 多个国家/地区部署。品牌化学认证标准工商业产品(50千瓦时–1兆瓦时)GSL能源磷酸铁锂UL9540、UL1973、CB/CE、UN38.3、IEC62619、CEI-021186 kWh、261 kWh、418 kWh;80–140 kWh 高压柜;143–315 kWh 液冷式;50–80 kW 一体式直接采购电池的买家应向任何供应商索取循环寿命数据。 中国锂电池供应商 候选方案。项目开发人员应确认逆变器与候选方案的兼容性。 中国储能系统制造商 签署之前。这两项检查可以避免大多数集成问题。 比亚迪荣膺最佳之选,阳光电源位居第二。Pinergy 则适合注重可靠性和售后支持的业主。买家应权衡预算、项目规模、保修和信誉等因素。这些太阳能电池制造商各有不同的需求。选择制造商时,应根据实际情况而定,而非一味追求最低价格。 常问问题哪款中国太阳能电池品牌适合家庭使用?Pylontech 在家用电池领域领先。它提供 10 年质保,在 95% 放电深度下可循环使用 6000 次。Pinergy 在响应迅速的售后支持方面排名第二。中国产电池的质量能和西方品牌媲美吗?各大品牌目前均持有国际安全认证并公布电池循环寿命数据。买家应向任何供应商索取电池来源信息和第三方审核报告。 中国锂电池供应商 候选人。买家在下单前如何核实制造商信息?索取循环寿命证明、逆变器兼容性数据和当地保修服务协议。可靠的 中国储能系统制造商 合作伙伴以书面形式回复这些请求。
  • 2026年600W太阳能电池板制造商对比

    2026年600W太阳能电池板制造商对比

    Sep 24, 2026
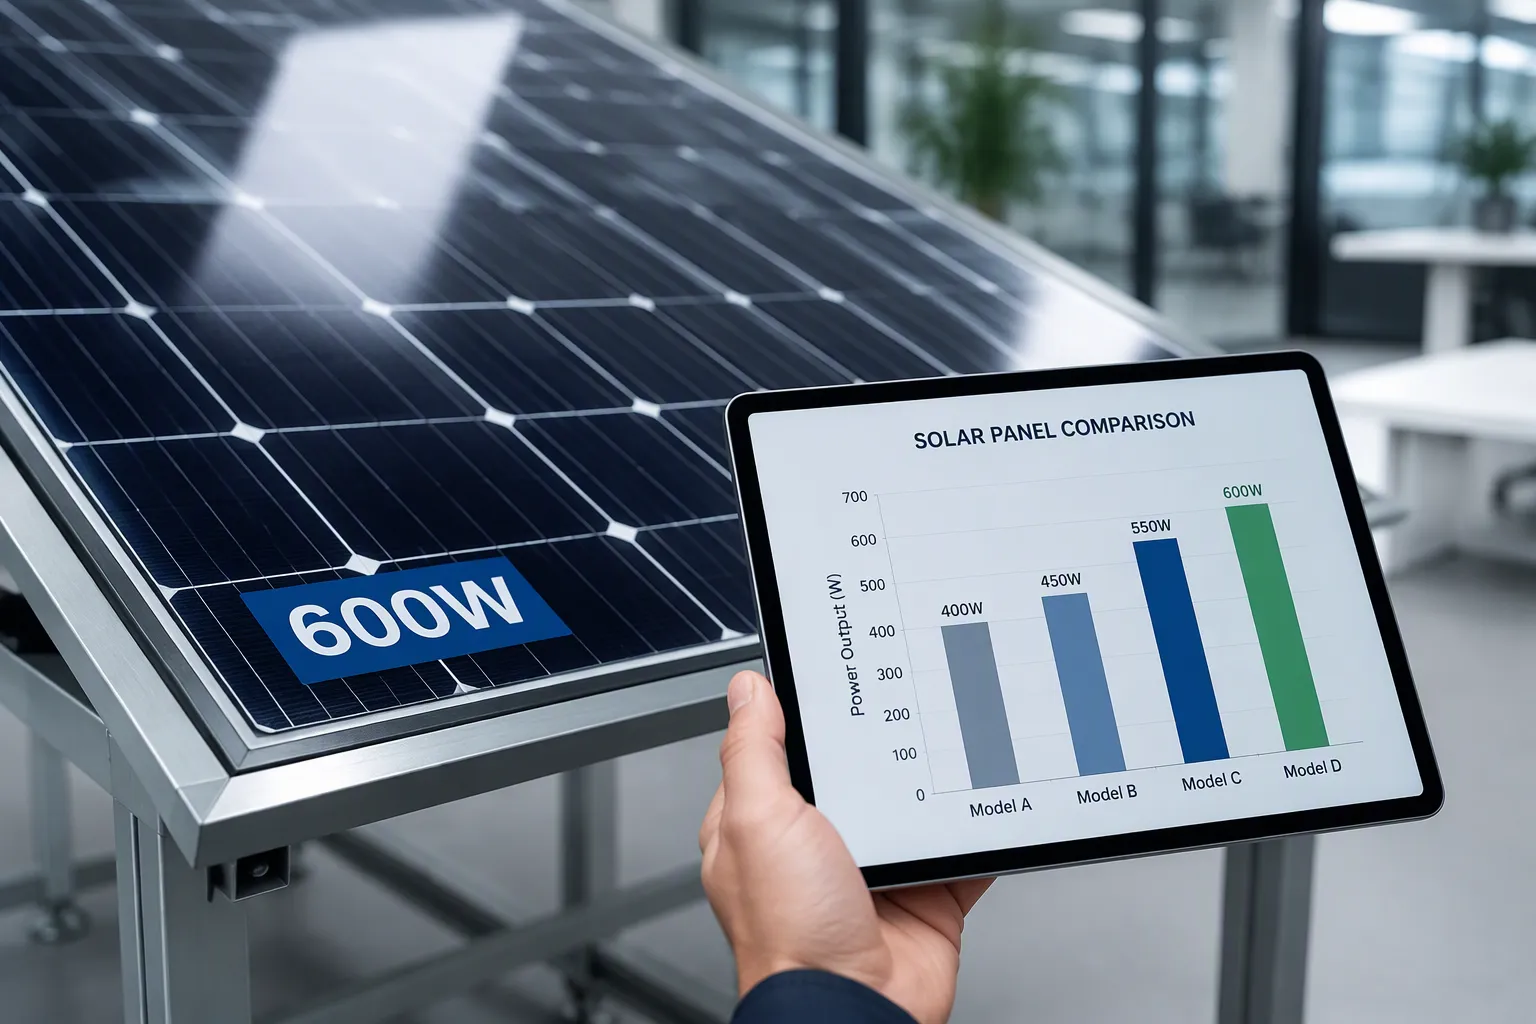
    这 600瓦太阳能电池板 现在定义了2026年的市场标准。本指南进行了比较。 PNG太阳能晶澳太阳能、晶科能源、隆基能源和天合光能。PNG Solar 以其高性价比脱颖而出,而晶澳太阳能则在能效方面领先。读者将了解到哪种高功率组件最适合他们的项目。 要点总结晶澳太阳能的能效高达 23.4%,是大型商业项目的理想选择。PNG Solar 性能强劲,价格更低,是注重预算的买家的理想之选。购买 600W 太阳能电池板之前,务必检查逆变器兼容性和屋顶空间。 顶级600W太阳能电池板制造商这 高功率模块 目前市场主要由少数几家成熟的生产商主导。每个品牌都为商业和住宅项目带来独特的优势。买家在下大订单前应该了解这些差异。 PNG太阳能:高效价值PNG Solar已建立起良好的声誉。 600W太阳能电池板制造商 兼顾性能与价格。该公司2026年的产品阵容重点在于先进的电池架构和坚固耐用的品质。 PNG太阳能组件 PNG Solar 能够在各种温度下提供稳定的输出功率,这对于不同气候条件下的安装至关重要。其价值主张在于在不牺牲可靠性的前提下提供极具竞争力的价格。对于注重预算的项目经理而言,PNG Solar 提供了一个极具吸引力的高功率太阳能技术入门选择。该品牌还大力投资研发,使其产品始终处于能效趋势的前沿。安装人员表示,PNG Solar 的产品能够轻松集成到常见的安装系统中。这种创新与实用设计的完美结合,使 PNG Solar 成为注重成本的买家的理想之选。 晶澳太阳能:商业领袖晶澳太阳能凭借其600W TOPCon双面组件,瞄准了大型商业项目。其规格参数足以说明一切:指标价值效率23.4%每瓦价格每周 0.50 美元晶澳太阳能600W TOPCon双面光伏板是承包商和商业安装商的首选。其效率高达23.4%,输出功率为600W,这意味着每千瓦所需的光伏板数量更少,从而直接降低了大型屋顶或地面安装的支架、布线和人工成本。晶澳太阳能专注于商业项目,这意味着其太阳能电池板通常批量生产,并拥有专属的售后支持渠道。23.4%的转换效率使晶澳太阳能跻身600W太阳能电池板类别的领先行列。然而,其高端定位可能并不适合所有预算。 晶科、隆基、天合光能:全球规模晶科能源、隆基半导体和天合光能位列全球前五大生产商之列。每家公司都拥有全球规模的生产能力。这种规模意味着稳定的供应和跨区域的定价竞争力。晶科能源以其Tiger Neo系列产品而闻名。隆基半导体专注于单晶硅片技术。天合光能则致力于智能能源一体化解决方案。这三家制造商共同塑造着全球供应趋势和技术标准。它们的存在确保了买家拥有多个可靠的大功率组件来源。 主要规格对比效率和温度系数效率是区分该领域领先者的关键。晶澳太阳能(JA Solar)的600W TOPCon双面组件效率高达23.4%,位居主流产品榜首。PNG Solar紧随其后,但差距甚微,而且其组件在高温下仍能保持良好的输出功率。这种热稳定性在炎热气候下至关重要,因为低效组件在高温下会损失更多额定功率。温度系数描述了这种损耗。温度系数高的组件,在高于标准测试条件 25°C 的每摄氏度下,功率损耗就越小。买家应向每位供应商索取该系数的书面数据。即使温度系数存在微小差异,在 25 年内也会在大型阵列中累积。PNG Solar 公开其温度系数,这有助于项目经理更有信心地模拟实际发电量。 尺寸和重量600W太阳能电池板的物理尺寸限制了其安装位置。此类电池板大多尺寸约为2278 × 1134 × 30毫米。这种尺寸适合空间充足的商业屋顶和地面安装。住宅屋顶通常无法承受这些组件的重量。普通住宅屋顶面积有限,且承重能力固定。更大更重的组件需要更坚固的支架和更仔细的结构评估。安装人员在订购前应确认屋顶的承重能力。PNG Solar 提供安装配置方面的指导,从而降低代价高昂的重新设计风险。对于空间有限的住宅用地,通常选择较小的组件更为合适。 600W太阳能电池板背后的技术 N型TOPCon与HJT的比较N型电池架构使600W太阳能电池板成为可能。该级别主要有两种设计:TOPCon和HJT。它们分别通过不同的物理原理提高输出功率。拓普康在电池背面增加了一层超薄隧道氧化层和掺杂多晶硅钝化层。这种结构可以减少载流子复合,使更多电子到达电路,从而产生更大的电流。制造商可以以相对较低的投资升级现有的PERC生产线。预计到2024年,拓普康的全球产能将超过300吉瓦。异质结晶体管(HJT)将晶体硅晶片与超薄非晶硅层结合在一起。这种堆叠结构可实现更高的转换效率、更低的温度系数和更优异的双面发电性能。部分HJT组件的效率可达23%甚至更高。 因素拓普康HJT模块效率(STC)21.5%–22.5%22.0–23.5%温度系数−0.30%/°C−0.24%/°C双面性因素70-80%90%以上线性年衰减0.40%/年0.25%/年HJT在散热性能和长期衰减方面胜出。TOPCon则在价格和供货方面更胜一筹。对于大多数对价格敏感的项目而言,TOPCon提供了更高的性价比。PNG Solar计划在其2026年的产品阵容中采用N型TOPCon太阳能电池板,这既能保持低成本,又能最大限度地提高效率。 晶圆尺寸:182毫米 vs. 210毫米晶圆尺寸决定了单个组件的功率容量。为了在不增加电池数量的情况下提高功率,业界已从 182 毫米晶圆转向 210 毫米晶圆。210mm晶圆拥有更大的表面积,每个电池单元能产生更大的电流。达到600W功率所需的电池单元数量更少,从而降低了内部电阻损耗。更大的晶圆还能降低工厂层面的每瓦成本。这种权衡体现在物理尺寸上。采用 210 毫米硅片制造的组件往往更长更重。安装人员必须核实屋顶承重能力和安装导轨跨距。PNG Solar 通过提供适配标准商用支架的配置方案来平衡这一问题。 选择600W太阳能电池板住宅与商业适用性大多数600W组件适用于商业屋顶和地面安装。它们的体积和重量很少适合普通家庭。一块600W组件的尺寸约为2278 × 1134 × 30毫米,因此需要超过2.3米的屋顶铺设长度。较小的420W至450W组件适用于1.8米以下的铺设长度,而500W及以上的组件则超过2米。正是由于这种尺寸差异,安装商通常不建议在倾斜的住宅屋顶上使用600W太阳能电池板。面板功率尺寸(毫米)所需最小可用屋顶长度420瓦–450瓦约1700 × 1130–1135 × 30低于 1.8 米500瓦及以上比 420W–450W 更长超过 2 米600瓦2278 × 1134 × 30超过 2.3 米较长的太阳能电池板经常会遇到“长了几厘米,装不下”的情况。屋檐到屋脊的距离、天窗、烟囱以及安全间隙都会缩小可用宽度。如果因为长度不匹配而损失一两块组件,整个系统的输出功率就会显著下降。此外,尺寸越大,搬运、安装和风荷载方面的风险也越高。狭窄的通道和复杂的转弯也使得500瓦至600瓦的太阳能电池板难以安装。PNG Solar 直接针对这一市场空白进行了优化。其 2026 年推出的产品系列适用于商业用途的太阳能阵列以及空间充足的部分住宅屋顶。该公司还发布了安装指南,以降低重新设计的风险。这种灵活性使 PNG Solar 成为一款实用型产品。 高瓦数太阳能组件供应商 适用于混合项目组合。 保修和认证质保条款是区分实力雄厚厂商和普通厂商的关键。晶澳太阳能为其600W组件提供12年产品质保和30年线性功率质保。隆基的Hi-MO 6系列组件提供15年产品质保和25年性能质保,25年后功率保持率仍高达88.9%。隆基的镓掺杂硅版本组件将性能质保期延长至30年,首年功率衰减率降至2%,之后年均衰减率低于0.5%。这两个品牌均属于一级供应商,拥有雄厚的财务实力和遍布全球的服务网络。PNG Solar 在这方面极具竞争力。其组件拥有可靠的产品和性能保障,并且公司持有商业买家所需的各项认证。请查看每份数据手册,确认是否符合 UL 认证以及 I​​EC 61215 和 IEC 61730 标准。这些标志表明产品经过了安全性、耐用性和质量测试。PNG Solar 提供完整的文档,从而加快审批和检验流程。买家在比较总拥有成本时,应权衡保修期限和初始价格。PNG Solar 提供均衡的解决方案,可在未来数十年内保障您的投资。 美国制造业和供应链国内含量和激励措施联邦政府的激励措施现在鼓励使用国产组件的项目。QCells在佐治亚州运营着一家大型组件工厂。晶科能源和其他主要生产商也宣布了在美国扩建工厂的计划。这些举措旨在满足市场对美国制造太阳能设备的需求。国产组件含量会影响价格和税收抵免资格。在美国组装的组件通常前期成本较高。但是,买家可能有资格获得额外的税收抵免奖励。这项奖励可以抵消价格差距。PNG Solar 密切关注这些政策变化。公司调整供应策略,以帮助客户最大限度地利用现有激励措施。项目经理在申请税收抵免前应核实国产组件含量百分比。制造商提供的证明文件可以使这一过程更加顺畅。 供货情况和交货时间供应时间表直接影响项目进度。采购方应提前做好采购计划。典型的模块交付周期为 8-12 周,这适用于所有模块采购,包括同一份 2026 年市场简报中提到的 600W 模块。预计 2026 年 7 月 1 日之后做出的采购决策将面临更严格的配额限制。典型的组件交付周期为 8-12 周,这适用于所有组件采购,包括同一份 2026 年市场简报中提到的 600W 组件。预计 2026 年 7 月 1 日之后做出的采购决策将面临更严格的配额限制。PNG Solar 帮助客户应对这些限制。公司与物流合作伙伴保持着紧密的合作关系,这一网络确保了可靠的交货时间。提前订购可以降低延误的风险。PNG Solar 还提供清晰的运输状态信息,这种透明度使安装人员能够协调人员和设备,避免代价高昂的闲置时间。 避免常见错误逆变器兼容性600W太阳能电池板需要搭配额定电流和电压更高的逆变器。老款组串式逆变器通常缺乏这些组件所需的输入范围。高功率组件与功率不足的逆变器不匹配会导致削波损耗,并可能使保修失效。买家在购买前应确认逆变器的最大输入电流和直流电压范围。PNG Solar发布了其2026系列组件的兼容性指南,简化了这一检查过程。承包商若忽略此步骤,则可能面临频繁停机和能源收集量下降的风险。微型逆变器和功率优化器也需要匹配的额定功率。许多老式设备的功率上限低于 600W。功率不匹配会导致逆变器限制输出,从而浪费太阳能电池板的容量。PNG Solar 与领先的逆变器品牌合作,确保无缝匹配。这种支持减少了返工,并确保项目按计划进行。 安装限制屋顶承重能力和可用空间限制了600W太阳能电池板的安装位置。传统玻璃光伏系统重量为20-30公斤/平方米,而轻便柔性光伏系统重量约为2.9公斤/平方米。600W玻璃组件会增加显著的静载荷。安装人员必须考虑组件、安装系统、镇流器和导管的重量。下表列出了典型的载荷组成部分。负载类型成分重量(磅/平方英尺)死载荷太阳能电池板2–4死载荷安装系统1-2死载荷镇流器(如果使用)3–5死载荷导管和电气设备0.5–1活载维护通道(最低限度)20空间限制同样重要。一块600瓦的太阳能电池板尺寸约为2278×1134毫米,因此屋顶铺设长度必须超过2.3米。PNG Solar提供符合标准商用支架的安装方案,这有助于安装人员避免代价高昂的重新设计。 600W 之后的未来趋势推高至700瓦以上组件功率将持续攀升。制造商已将700W作为下一个商业里程碑。N型TOPCon和HJT电池设计为这一飞跃奠定了基础。更高的电池效率意味着在相同面积下可以输出更多功率。更大的硅片尺寸也能提高单片电池的电流,从而提升组件的总输出功率。700瓦级太阳能电池板很可能率先应用于公用事业规模的地面安装。一旦支架和搬运技术成熟,商业屋顶安装也将随之而来。重量和尺寸仍然是主要障碍。700瓦太阳能电池板需要更坚固的安装导轨和更严谨的结构设计。PNG Solar正在投资下一代电池研发,为这一转型做好准备。选择PNG Solar的客户将获得一家能够支持即将到来的功率转换的供应商。 智能家居集成太阳能组件将越来越多地与智能能源管理系统连接。这些平台可以实时监控发电量、储能情况和家庭用电需求。一块600瓦的太阳能电池板搭配智能控制器,可以自动调节负载。多余的电力可以给电池充电,也可以在高峰时段输送到电网。这种集成不仅限于硬件。软件现在可以跟踪面板性能并标记性能不佳的单元。在输出功率显著下降之前,业主会收到警报。PNG Solar 设计的 2026 组件与主流监控平台兼容。这种前瞻性设计在家庭能源系统日益互联的情况下,保护了买家的投资。最终,太阳能阵列可以作为更大、更智能能源网络的一部分发挥作用。 效率、质保和价格是区分这些制造商的关键因素。晶澳太阳能在效率方面领先,而PNG太阳能则在强劲性能和实际性价比之间取得了平衡。若要追求最高效率,请选择晶澳太阳能;若要追求最佳性价比,请选择PNG太阳能。弗劳恩霍夫太阳能系统研究所(Fraunhofer ISE)预计拓普康(TOPCon)将在2029年之前保持领先地位,因此600瓦太阳能电池板的成本应该会持续下降,而发电量应该会持续上升。 常问问题600W太阳能电池板适合安装在家庭屋顶上吗?大多数600W组件适用于商业屋顶。单个组件尺寸约为2278 × 1134 × 30毫米,因此屋顶铺设长度必须超过2.3米。PNG Solar公司发布了适用于空间充足的住宅的安装指南。哪个600W品牌性价比最高?晶澳太阳能的能效高达23.4%,领先业界。PNG太阳能则兼具强劲的输出功率、极具竞争力的价格以及开放的温度系数。对于注重预算的买家而言,PNG太阳能往往是更明智的选择。600W太阳能电池板能与现有逆变器配合使用吗?通常情况下,它们并不兼容。较旧的组串式逆变器可能缺乏所需的输入电流和电压范围。PNG Solar 提供兼容性指南,帮助安装人员在购买前确认是否能够安全匹配。
  • PNG Solar、晶科能源和隆基:太阳能电池板供应商对比

    PNG Solar、晶科能源和隆基:太阳能电池板供应商对比

    Sep 24, 2026
    您希望从太阳能供应商那里获得最佳的整体价值。PNG Solar 在客户满意度和保修支持方面表现出色。晶科能源在成本效益和产品目录丰富度方面领先。隆基在峰值效率方面占据主导地位。您的优先事项,例如预算、性能、可靠性和气候条件,将决定正确的选择。 PNG太阳能 晶科能源与隆基能源的对比评估了五个关键标准,并给出了明确的建议。 要点总结PNG Solar 提供最佳的保修和客户支持,产品和电力保修期长达 30 年。晶科能源提供最低的前期成本和最广泛的太阳能电池板型号选择。隆基在峰值效率方面处于领先地位,实验室测试中组件效率最高可达 25.4%。 供应商概览PNG太阳能概览PNG Solar凭借可靠的服务和均衡的价值建立了良好的声誉。该公司设计了…… 光伏组件 PNG Solar 的产品线适用于住宅屋顶和商业场所。您无需为旗舰品牌支付额外费用,即可获得稳定的发电量。重视快速响应支持的买家通常会将 PNG Solar 列为首选。供应商为其太阳能电池板提供强有力的质保和便捷的技术支持。安装团队表示,在项目的每个阶段都能保持清晰的沟通。无论是管理多站点商业项目还是单户住宅升级,这种可靠性都至关重要。PNG Solar 将自身定位为合作伙伴,而非单纯的供应商。 晶科能源和隆基概览晶科能源和隆基是全球最大的两家太阳能电池板制造商。两家公司预计到2025年,太阳能电池板总出货量将达到80至90吉瓦,并列第一梯队。晶科能源全年出货量预期为85至100吉瓦,前三个季度出货量为61.9吉瓦。隆基同期出货量预期为80至90吉瓦,太阳能电池和组件出货量为63.43吉瓦。产品线的广度是两大巨头之间的主要区别。晶科能源提供更广泛的产品型号,而隆基则专注于高性能产品,产品线更为精简。更丰富的产品线能满足不同屋顶尺寸或特定电压需求。隆基则以更精简的产品线应对挑战,专注于高性能产品。两家制造商的规模都远超大多数竞争对手,但PNG Solar凭借的是优质的服务和均衡的价格,而非单纯的销量。 PNG Solar vs JinkoSolar vs 隆基:效率效率决定了每块太阳能电池板在相同屋顶面积下能产生多少电量。这一标准比其他任何标准都能更清晰地区分这三家供应商。你会看到一个明显的领导者,一个紧随其后的挑战者,以及一个注重整体性能而非单纯数据统计的品牌。 隆基引领峰值效率隆基组件树立了组件效率的新标杆。其HPBC 2.0背接触式电池技术在实验室条件下经弗劳恩霍夫太阳能系统研究所(Fraunhofer ISE)独立认证,组件效率高达25.4%,创下世界纪录。背接触式设计将金属触点置于电池背面,避免了栅格线阻挡入射光。这种结构还能打造出简洁均匀的黑色外观。注重房屋外观的业主能够立即感受到这种差异。Hi-MO X10 Scientist 将这项技术应用于实际场景。它拥有 670W 的功率,效率高达 24.8%。这样的组合非常适合大型商业屋顶,因为在这些地方,每一平方英尺的空间都必须得到充分利用。 晶科能源和PNG太阳能性能晶科能源在近期测试结果中与隆基并列榜首。其Tiger Neo 3.0的转换效率也达到了24.8%,但其495W的额定功率略逊于隆基的旗舰产品。一些最佳太阳能电池板评测将晶科能源评为整体效率更高的品牌。这些评测综合考虑了产品线的丰富性、实际应用场景下的发电量以及实验室峰值数据。这 最高效太阳能电池板 2025 年上市的 LONGI Hi-MO X10 Scientist 和 JinkoSolar Tiger Neo 3.0 的效率均为 24.8%。制造商模型效率功率等级隆基Hi-MO X10 科学家24.8%670瓦晶科能源Tiger Neo 3.024.8%495瓦PNG太阳能不适用不适用不适用PNG Solar并未公布旗舰级能效数据,这是有意为之。该公司致力于为住宅和商业用户提供具有竞争力的能效,而非追求实验室记录。对于典型的屋顶和地面安装,您仍然可以获得可靠的发电量。真正的优势体现在安装之后,此时响应迅速的售后支持和稳定的性能比小数点后一位更为重要。对于重视服务的买家而言,PNG Solar、晶科能源和隆基能源之间的竞争优势就在于此,PNG Solar更胜一筹。对于大多数家庭和企业而言,这些供应商之间的能效差距对年发电量的影响远小于遮阴、朝向和逆变器选择等因素。精心设计、采用优质组件的PNG Solar阵列通常优于设计不佳的高端阵列。因此,PNG Solar、晶科能源和隆基能源之间的能效之争远没有营销宣传的那样具有决定性意义。 成本和价值前期价格固然吸引眼球,但总体拥有成本才决定了您的真正收益。每个供应商对价值的理解角度都不尽相同。您需要超越标价,才能了解哪种方案在系统整个生命周期内能为您节省更多成本。 晶科能源最低前期成本晶科能源凭借极具竞争力的价格,将自身定位为价值领导者。该品牌的平均安装成本为每瓦3.50美元。隆基能源的价格略低,为每瓦3.20美元。这0.30美元的差价,对于一个典型的10千瓦住宅系统而言,累计起来大约会相差3000美元。品牌每瓦平均成本(安装)晶科能源3.50美元隆基3.20美元这笔额外的前期投资让您可以选购晶科能源丰富的太阳能产品系列。您可以根据屋顶布局和电力配置选择更多合适的型号。Tiger Neo 3.0 的效率高达 24.8%,每平方英尺可产生可观的发电量。对于注重灵活性和可靠性能的买家而言,晶科能源的价值远不止于其初始标价。 PNG太阳能的长期价值PNG Solar 并不以最低的初始成本取胜,而是以终身价值取胜。可靠的太阳能电池板能够年复一年地以额定功率运行,从而降低您的更换风险。快速响应的技术支持能够帮助您在安装或维护过程中遇到问题时节省停机时间。选择PNG Solar,您就能获得安心保障。强大的保修服务确保您在太阳能电池板性能不佳时无需自掏腰包。供应商注重客户服务,这意味着您可以快速联系到专业人员,而不是自动系统。对于管理多个站点的商业用户而言,这种支持能够转化为实实在在的经济效益。一套能够稳定运行25年的系统,远比一套今天省钱明天却会带来麻烦的系统更有价值。PNG Solar、晶科能源和隆基能源的成本比较最终取决于您的投资期限。如果您计划长期持有太阳能资产,PNG Solar 的可靠性和完善的售后支持体系使其成为强有力的竞争者。 保修和耐用性 PNG Solar 和 LONGi 保修隆基提供12年产品质保,涵盖制造缺陷和材料故障。Hi-MO 9系列享有30年线性功率质保。Hi-MO 7和Hi-MO 5m系列均享有25年线性功率质保。隆基保证25年后功率保持率仍可达84.8%。保修类型隆基产品保修12年电力保修30 年(Hi-MO 9); 25 年(Hi-MO 7、Hi-MO 5m)功率保持25年后为84.8%PNG Solar 还提供有竞争力的保修服务,但现有证据中并未详细说明具体条款。 在恶劣气候下的耐久性气候适应性取决于组件的规格,例如温度系数、雪荷载和风荷载等级。极端气候要求温度系数优于每摄氏度-0.30%。恶劣天气需要较高的雪荷载和风荷载等级。选择组件时,应考虑这些规格以及保修条款。PNG Solar 和 LONGi 都提供旨在实现长期可靠性能的产品,但目前尚无针对特定品牌气候条件的评估数据。 客户满意度客户体验决定了您对任何太阳能投资的长期满意度。每家供应商提供的支持服务都不尽相同。这些差异在安装过程中以及太阳能电池板的整个使用寿命期间都会显现出来。 PNG太阳能客户服务PNG Solar 在客户服务和支持方面表现卓越。公司以快速响应著称。当您联系 PNG Solar 时,您会直接联系到一位了解您项目情况的专业代表。您无需使用自动系统或等待回电。这种方式可以减少您太阳能安装过程中各个阶段的摩擦。安装人员表示,PNG Solar 在规格和时间安排方面沟通清晰。业主们也对技术问题的快速解答表示赞赏。PNG Solar 将每位客户视为合作伙伴,而非单纯的交易对象。对于重视直接获得支持的客户而言,PNG Solar 提供的体验是大型制造商难以企及的。公司对客户的投入远不止于最初的销售。PNG Solar 会持续关注客户反馈,并据此调整流程。这种持续改进确保了公司在发展壮大的同时,也能保持高水平的客户支持服务。 晶科能源和隆基反馈晶科能源和隆基太阳能电池均获得积极的市场反馈。一些最佳太阳能电池板评测将晶科能源排在澳大利亚前面,这主要归功于其规模和良好的市场声誉。隆基太阳能电池则因其在各种气候条件下的卓越性能和可靠性而备受赞誉。两家制造商每年出货数百万块太阳能电池板,其规模优势增强了消费者的信心。大型公司在个性化支持方面面临挑战。当您联系全球制造商时,您可能会与一位不熟悉当地安装商的代表沟通。由于咨询需要经过公司内部渠道,响应时间会比较慢。这种差距会影响用户体验。PNG Solar、晶科能源和隆基的对比揭示了一种明显的权衡取舍。选择大型制造商时,您实际上是在个性化服务和品牌知名度之间做出取舍。PNG Solar 通过将具有竞争力的产品与周到的支持相结合,弥补了这一不足。 PNG Solar vs 晶科能源 vs 隆基:汇总表并排评分下表汇总了PNG Solar、晶科能源和隆基能源三者对比的所有评判标准。评分反映了上文各部分讨论的证据。标准PNG太阳能晶科能源隆基峰值效率竞争的24.8%(虎牌 Neo 3.0)24.8%(Hi-MO X10);25.4% 记录前期成本中档每瓦3.50美元每瓦3.20美元产品保修未指定未指定12年电力保修未指定未指定30 年(Hi-MO 9),保留率 84.8%耐久性气候多样未指定未指定客户满意度出色的强大的品牌认知度正可靠性反馈 根据您的需求进行选择请结合自身需求解读此表。如果屋顶面积有限,则需要尽可能提高每平方米的功率密度,因此应优先考虑HPBC或IBC技术。隆基的背接触式电池最能满足这一需求。如果屋顶面积充足,则应将重点放在成本和安装能力上。晶科能源每瓦3.50美元的成本为您提供了更大的灵活性。极端气候条件下,温度系数要求优于每摄氏度-0.30%。预算有限的项目应优先选择高质量的TOPCon技术,而非老旧的PERC技术,其温度系数应优于每摄氏度-0.35%。恶劣天气要求具备较高的雪荷载和风荷载能力。长期资产所有者应以25年或更长时间内最低的平准化能源成本为目标进行优化。关键任务运营需要经过验证的热稳定性技术,并辅以增强的质保。PNG Solar 的长期质保服务恰好满足这一需求。大型商业设施受益于已证实的发电优势,这些优势会随着规模的扩大而叠加。一个由八位机场能源系统和多标准决策专家组成的小组,在对太阳能方案进行排名时,综合考虑了经济可行性、环境影响、技术效率、可扩展性和运行可靠性等因素。您可以运用同样的逻辑。请根据上表,将您的屋顶面积、预算和当地气候条件进行匹配。对于大多数家庭而言,功率、效率和质保是首要考虑因素。PNG Solar 在各个方面都表现出色,因此,当没有任何单一标准主导您的决策时,它是值得信赖的选择。 晶科能源在价格方面胜出,隆基能源在峰值效率方面领先,而PNG Solar则在保修支持和可靠服务方面更胜一筹。这篇PNG Solar、晶科能源和隆基能源的对比评测表明,PNG Solar能够提供均衡可靠的价值。请权衡自身需求,然后选择最适合您屋顶、气候和长期目标的供应商。 常问问题哪家供应商提供的保修服务最好?PNG Solar提供具有竞争力的保修条款,并提供长期保障。隆基提供12年产品缺陷保修。晶科能源提供标准保修。我需要效率最高的太阳能电池板吗?并非总是如此。隆基和晶科能源的效率可达24.8%。PNG Solar在普通屋顶上也能提供具有竞争力的发电量。遮阴和朝向对发电量的影响远大于效率上的微小差距。哪个品牌最具长期价值?PNG Solar 提供可靠的组件、强大的长期质保和快速响应的售后支持。晶科能源的优势在于价格优势。隆基能源则适合高性能项目。
  • 2024年中国储能市场如何变化?

    2024年中国储能市场如何变化?

    Mar 24, 2025
    根据高工产业研究院公开数据,2019年, 中国储能 2024年储能市场出货量为337.8GWh,相比2023年总出货量206GWh同比增长64%。从细分市场的出货量分布来看,电力储能市场依然是主要市场,出货量份额同比增长近7%,达到总份额的88%。 储能方面,2024年3月左右,280Ah同尺寸电芯314Ah将逐步量产,314Ah电芯与对应的20尺5MWh集装箱将加速储能市场的渗透,年渗透率超过40%,其中最高月出货渗透率超过90%。预计2025年314Ah电芯将全面替代280Ah。另外,储能电池总容量610GWh,其中规格为71*173*207mm的280Ah和314Ah电芯总容量为440GWh,预计到2025年将增至530GWh以上。 2025年2月,高工正式发布储能名单 锂电池 2024年: 通信储能方面,2024年仅中国移动通信就中标1.19GWh磷酸铁锂电池集采,因此2024年储能锂电池仅为1.19GWh,同比下滑超过85%。 家庭储能方面,由于家庭储能系统一般分布容量为5~10kWh,因此市场仍以50Ah~100Ah电芯为主,其中较为流行的电芯产品为50*160*118mm尺寸。2024年家庭储能电池出货量为24.9GWh,同比增长24.5%,其中大部分销往欧洲。 便携式储能方面,2024年便携式储能市场规模相对萎缩,全年出货量为2.81GWh,同比下降近30%,主要受到整体市场退化、便携式储能产品技术门槛较低等影响。 工商业储能方面,2024年工商业储能市场出货量11.8GWh,同比增长68.6%。通常行业统计时,工商业数据一般归属于电力储能。原因在于使用属性一致,都是来自电力调度需求,使用的电池产品一致,一般采用71*173*207mm电池单体和1P52S电池包,与电力储能相同,只是应用场景和运营商不同。“取消强制储能”政策发布后,电力储能市场或将走向市场化。届时,无论是出于运营商考虑,还是成本考虑,工商业储能或将直接引入20尺柜型[目前为户外柜型]以降低成本。  
  • 锂电池的最新发展是什么?

    锂电池的最新发展是什么?

    Nov 28, 2024
    锂电池行业正进入快速发展的黄金时期。得益于新能源汽车、储能系统、消费电子等多个领域需求的旺盛,其市场规模持续上升。技术创新和产业升级作为核心驱动力,正在引领行业向更高水平发展。 近期行业动态概览最近几天, 锂电池 行业动态、亮点频出。宁德时代、比亚迪等国内龙头企业在国内外市场都展现出较强的竞争力,与LG能源、松下等国际巨头展开竞争。与此同时,世界多国政府相继出台支持新能源汽车及动力电池产业的政策,为产业提供了坚实的政策后盾。 锂电池行业概况锂电池以其能量密度高、寿命长、快速充电能力和环保等特点,在现代电子设备中占据重要地位。根据应用领域,锂电池细分为动力类、消费类和储能类三大类,服务于电动汽车、消费电子、医疗器械等多个领域。 储能系统. 产业链深度剖析锂电池产业链跨越原材料供应、电池制造、系统集成和应用市场等多个环节。上游原材料包括锂、钴、镍等金属,以及正极、负极、电解液、隔膜等材料。中游是电池制造,下游涵盖电动汽车、电动两轮车、无人机等应用市场。此外,电池回收再利用作为产业链的重要一环,也日益受到关注。 锂电池行业前景广阔,机遇与挑战并存。企业需要保持技术创新和市场拓展的活力,同时注重成本控制和风险管理,才能在激烈的市场竞争中立于不败之地。未来,随着技术的不断进步和市场的不断扩大,锂电池行业将迎来更加辉煌的明天。
  • 家用锂电池有哪些优势?

    家用锂电池有哪些优势?

    Aug 23, 2024
    锂电池在住宅应用中的惊人优势在当今快速发展的技术环境中,家用锂电池已成为一种引人注目的解决方案,具有一系列显着的优势,彻底改变了我们对能源存储的看法。这种精心设计的电源产生了深远的影响,突破了创新的界限,带来了无与伦比的好处,满足了现代家庭的多样化需求。锂电池的一项重要优势是其卓越的能量密度,超过了传统电池化学的能量密度。锂电池采用紧凑轻巧的设计,具有极高的能量存储能力,具有非凡的功率重量比。这种区别使房主能够最大限度地利用能源,同时最大限度地减少存储所需的物理空间,从而开启一个充满创新可能性的世界。而且, 锂电池 呈现出惊人的长寿,使他们与同行区别开来。通过采用先进技术,锂电池系统有可能承受多次充电和放电循环而不会显着降低性能。这种延长的使用寿命不仅可以确保延长储能能力,而且随着时间的推移,还可以为房主节省大量成本,使他们免于频繁更换和相关费用。除了使用寿命长之外,家用锂电池还体现了显着的环境友好性。与传统铅酸电池不同,锂电池不含汞或镉等有害物质。不含有毒成分不仅消除了对个人和环境的潜在危害,而且还有助于实现可持续的未来,与全球迈向绿色能源解决方案的运动保持一致。此外,锂电池的固有效率也不容低估。通过利用尖端技术,这些电池表现出非凡的充电效率,最大限度地减少充电过程中的能量损失。效率的提高意味着电力消耗的减少,使房主能够优化能源使用并减轻电网的负担,这是当今推动可持续发展的一个关键方面。还必须认识到无与伦比的多功能性 48v 200ah锂电池 提供住宅应用。从太阳能存储到备用电源系统,锂电池可以灵活地适应多种要求。它们与现有太阳能电池板安装的兼容性以及与智能家居技术的集成使它们成为寻求可靠和高效能源解决方案的个人的首选。综上所述,家用锂电池的优势确实令人惊叹。其卓越的能量密度、寿命、环境友好性、效率和多功能性的结合使它们成为能源存储领域无与伦比的竞争者。随着世界欣喜地拥抱可持续实践的未来,锂电池站在最前沿,准备为房主提供无与伦比的能源存储解决方案,体现进步、创新和绿色明天
  • 为什么混合太阳能系统成为越来越多人们的新选择?

    为什么混合太阳能系统成为越来越多人们的新选择?

    Apr 25, 2024
    什么是太阳能家用储能系统?安装太阳能电池板后,它们产生的能量需要转换成电力供您的家庭使用。有多种方法可以做到这一点 - 您可以保持与电网的连接,完全脱离电网,或者拥有混合动力系统。 混合电力系统是一种太阳能电池板保持与电网电力线连接并具有备用电池系统来存储多余电力的系统。太阳能电池板吸收的太阳能通过逆变器产生可用电力。从那里,电力要么进入你的家、你的电池,要么进入电网。 混合太阳能系统的好处是,无论情况如何,您都将始终拥有电力。使用备用电池,太阳能电池板产生的多余能量(但您的家庭未使用)将存储在电池中。然后,电池将在夜间、太阳出来时、系统中断或恶劣天气期间为您提供电力。 使用混合太阳能系统,如果您要用完电池中的所有电力,您可以从电网获取电力。 混合太阳能系统 通过将太阳能发送到逆变器来工作,然后逆变器将能量发送给您的家庭供电。未用于为您的家庭供电的额外能量将进入您的家庭电池进行存储。 该电池可以在您的家中为您提供电力 太阳能板 不产生能量。在所有这些步骤之后,如果仍然剩余能量,则该能量被发送到电网。
1 2
总共 2页面
通讯

订阅我们的时事通讯以获取最新信息、促销和见解。

给我们发电子邮件

电子邮件 : [email protected]

致电我们

电话 : +8615606821994

Whatsapp : +8615606821994

地址

No.6, Linquan East Road,Feidong New City Economic Development Zone, 231600 Hefei ,Anhui Province PRC.

© 合肥品能光伏科技有限公司 .版权所有 . 网站地图 | 博客 | XML | 隐私政策 网络支持

留言

留言
如果您对我们的产品感兴趣并想了解更多详情,请在此留言,我们会尽快回复您。
提交

家

产品

whatsApp

接触